

Spatial Assessment of Indoor Air Quality and Variability in Pollutant Concentrations (Radon, CO₂, and VOCs) in Rural Primary Schools in Al-Sawb Al-Saghir, Al-Kufa, Iraq
التقييم المكاني لجودة الهواء الداخلي وتباين الملوثات (الرادون وثاني أكسيد الكربون والمركبات العضوية المتطايرة) في المدارس الابتدائية الريفية في الصوب الصغير، الكوفة، العراق
Naba Talib Nomas1
1 College of Pharmacy, Jaber bin Hayyan University of Medical and Pharmaceutical Sciences, Najaf, Iraq
DOI: https://doi.org/10.53796/hnsj79/52
Arabic Scientific Research Identifier: https://arsri.org/10000/79/52
Volume (7) Issue (9). Pages: 1025 - 1038
Received at: 2026-08-15 | Accepted at: 2026-08-22 | Published at: 2026-09-01
Abstract: Indoor air quality in schools is an important environmental issue, because children spend a lot of time in classrooms where inadequate ventilation and the accumulation of indoor pollutants can affect comfort, health and learning conditions . The objective of this study is to evaluate the spatial variation of indoor air quality in 30 rural primary schools in Al-Sawb Al-Saghir, Al-Kufa, Al-Najaf Governorate, Iraq, with particular emphasis on radon (²²²Rn), carbon dioxide (CO₂), and volatile organic compounds (VOCs). An indoor passive detector was used to monitor radon for 72 h under representative classroom conditions and an indoor air-quality monitoring system was used to measure CO2 and VOCs. The recorded measurements were then input into a Geographic Information System (GIS) for analysis of the spatial distribution and detection of variations across the investigated schools. The results showed that the radon concentrations ranged from 39 to 77 Bq/m3, below the WHO reference level of 100 Bq/m3. The CO2 concentrations varied from 870 to 1600 ppm, with 24 of the 30 schools exceeding 1000 ppm, indicating that ventilation is the main aspect to be addressed. The concentration of TVOC ranged between 0.07 and 0.27 mg/m³, always lower than the indicative level of 0.30 mg/m³. The reported differences across schools show that indoor air quality is not homogeneous across the study area and could be influenced by classroom ventilation, occupancy, building characteristics and local environmental conditions, from a spatial perspective. The joint assessment of radon, CO2 and VOCs gives a better picture of the indoor environment than single pollutant assessment. In general, results show good radon and TVOC conditions. However, the elevated CO 2 levels indicate that there is room for improvement in ventilation practices in rural classrooms. The use of environmental measurements in combination with GIS is an effective method to visualize the variation of pollutants and future indoor air-quality management and environmental health assessment in Iraqi schools.
Keywords: Indoor Air Quality, Radon, Carbon Dioxide, Volatile Organic Compounds, Rural Schools, GIS; Al-Kufa, Iraq.
المستخلص: تُعدّ جودة الهواء الداخلي في المدارس قضية بيئية مهمة، إذ يقضي الأطفال وقتًا طويلًا داخل الفصول الدراسية، حيث يمكن أن يؤثر ضعف التهوية وتراكم الملوثات الداخلية في الراحة والصحة وظروف التعلّم. هدفت هذه الدراسة إلى تقييم التباين المكاني لجودة الهواء الداخلي في 30 مدرسة ابتدائية ريفية في الصوب الصغير، الكوفة، بمحافظة النجف، العراق، مع التركيز على الرادون (²²²Rn)، وثاني أكسيد الكربون (CO₂)، والمركبات العضوية المتطايرة (VOCs). استُخدم كاشف سلبي داخل المباني لرصد الرادون لمدة 72 ساعة في ظروف ممثلة لبيئة الفصول الدراسية، كما استُخدم نظام لمراقبة جودة الهواء الداخلي لقياس تركيزات ثاني أكسيد الكربون والمركبات العضوية المتطايرة. وأُدخلت القياسات المسجلة في نظام المعلومات الجغرافية (GIS) لتحليل التوزيع المكاني وتحديد التباينات بين المدارس المشمولة بالدراسة. أظهرت النتائج أن تركيزات الرادون تراوحت بين 39 و77 بيكريل/م³، وهي أقل من المستوى المرجعي لمنظمة الصحة العالمية البالغ 100 بيكريل/م³. وتراوحت تركيزات ثاني أكسيد الكربون بين 870 و1600 جزء في المليون، وتجاوزت 1000 جزء في المليون في 24 مدرسة من أصل 30 مدرسة، مما يشير إلى أن التهوية تمثل الجانب الرئيس الذي ينبغي معالجته. أما تركيزات إجمالي المركبات العضوية المتطايرة (TVOC)، فتراوحت بين 0.07 و0.27 ملغم/م³، وظلت جميعها دون المستوى الاسترشادي البالغ 0.30 ملغم/م³. وتُظهر الفروق المسجلة بين المدارس أن جودة الهواء الداخلي غير متجانسة مكانيًا في منطقة الدراسة، وقد تتأثر بتهوية الفصول الدراسية، وكثافة الإشغال، وخصائص المباني، والظروف البيئية المحلية. يوفر التقييم المشترك للرادون وثاني أكسيد الكربون والمركبات العضوية المتطايرة صورة أشمل للبيئة الداخلية مقارنةً بتقييم ملوث واحد. وبوجه عام، تشير النتائج إلى مستويات جيدة فيما يتعلق بالرادون وإجمالي المركبات العضوية المتطايرة، إلا أن ارتفاع مستويات ثاني أكسيد الكربون يدل على الحاجة إلى تحسين ممارسات التهوية في الفصول الدراسية الريفية. ويُعدّ الجمع بين القياسات البيئية ونظم المعلومات الجغرافية أسلوبًا فعالًا لتمثيل تباين الملوثات مكانيًا، ودعم الإدارة المستقبلية لجودة الهواء الداخلي وتقييم الصحة البيئية في المدارس العراقية.
الكلمات المفتاحية: جودة الهواء الداخلي، الرادون، ثاني أكسيد الكربون، المركبات العضوية المتطايرة، المدارس الريفية، نظم المعلومات الجغرافية، الكوفة، العراق.
1. Introduction
Indoor air quality (IAQ) is a significant environmental and public health issue, especially in schools where children spend multiple hours per day in enclosed environments. Poor indoor air quality can result from inadequate ventilation, high occupancy, building materials, cleaning activities, and infiltration of outdoor pollutants. Children are thought to be especially vulnerable to environmental contaminants because their respiratory systems are in development and they breathe more air relative to their body size [1,2].
Thus, it is necessary to monitor indoor pollutants in primary schools to assess possible exposure and to ensure a healthy educational environment.Radon (²²²Rn), carbon dioxide (CO₂) and volatile organic compounds (VOCs) are among the pollutants of concern and are important indicators of different aspects of indoor air quality. Radon is a naturally occurring radioactive gas from the decay of uranium and radium in the soil and rocks. It can get into buildings through cracks, foundations, floors, and other openings and can accumulate indoors if there is poor ventilation. Long-term inhalation of radon and its decay products is a well-established risk factor for lung cancer, and indoor radon surveillance is a significant public-health priority [3,4].
A significant indoor source is respiration by people . * Carbon dioxide : A gas often used to determine the adequacy of ventilation . High occupancy and low air exchange rate in classrooms are associated with high CO 2 concentrations, but are also a condition for accumulation of other indoor pollutants [5].
VOCs are also emitted from a variety of indoor sources including paints, furniture, flooring, adhesives, cleaning products, and other building and consumer materials. Some of the VOCs can cause irritation and other adverse health effects and some compounds are carcinogenic [6,7].
These pollutants can vary widely in concentration in different school buildings depending on building design, construction materials, ventilation, occupancy, maintenance, and surrounding environmental conditions. This spatial variability is particularly relevant in rural areas, where school buildings may vary widely in age, construction characteristics, ventilation practices and interaction with the underlying soil. Studies have highlighted the significance of building characteristics, ventilation, occupancy and environmental conditions in the assessment of IAQ in educational institutions [1,8].
The climatic conditions and the widespread use of closed or mechanically cooled classrooms in Al-Kufa, Iraq may influence the ventilation patterns and thus the accumulation of indoor pollutants. The variation in indoor pollutant levels among rural primary schools in Al-Sawb Al-Saghir may be due to the differences in construction and environmental characteristics. Thus, the present work aims to evaluate the spatial distribution and variability of radon, CO₂ and VOCs in rural primary schools of Al-Sawb Al-Saghir, Al-Kufa, Iraq. The results are expected to be useful as baseline information for the evaluation of indoor environmental conditions and the support of appropriate ventilation, maintenance and exposure-reduction strategies in primary schools.
2: Study Area
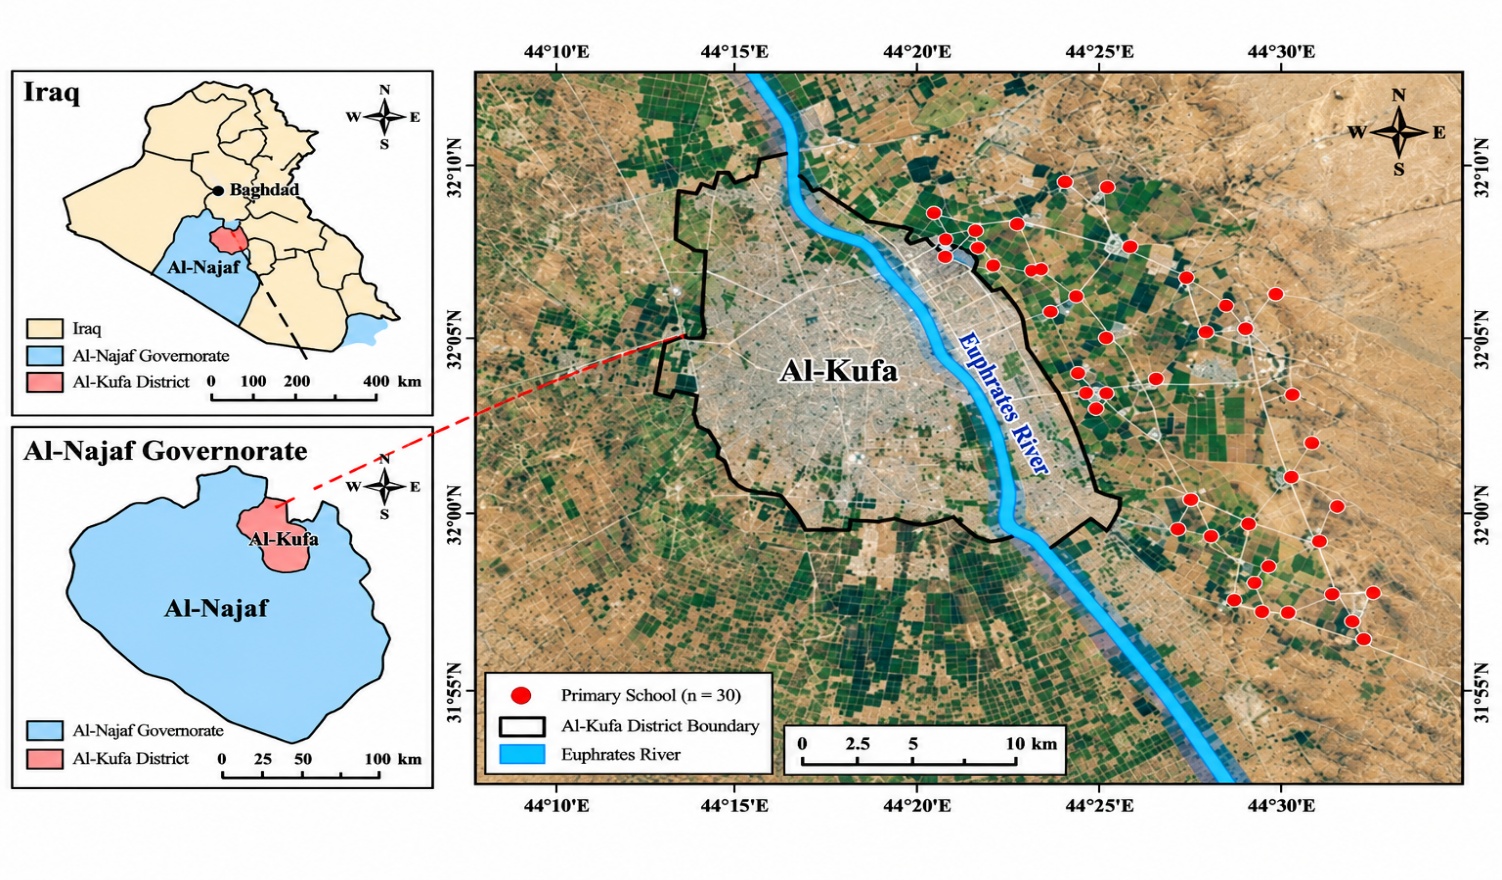
Figure 1. Geographical Location of Al-Kufa District and Spatial Distribution of the 30 Rural Primary Schools in Al-Sawb Al-Saghir, East of the Euphrates River, Al-Najaf Governorate, Iraq.
The study was carried out in the rural area of Al-Sawb Al-Saghir located to the east of the Euphrates River concerning Al-Kufa District, Al-Najaf Governorate, Iraq. Al-Kufa is located in the north of Al-Najaf Governorate and represents an important urban and agricultural center with a strong link to the Euphrates river and the surrounding rural areas. The Al-Sawb Al-Saghir area usually comprises rural and agricultural landscapes where agricultural fields, scattered residential settlements, local roads and educational facilities constitute an integrated landscape. The combination of rural features and school settings creates a good place to examine differences in indoor air quality.For the current study, 30 rural primary schools all over Al-Sawb Al-Saghir were selected as sampling locations. The location of the selected schools was documented and mapped on a Geographic Information System (GIS) to show the geographical distribution of the schools and proximity to Al-Kufa, river Euphrates and the rural environment. The schools are spread out over the eastern side of the Euphrates and are not concentrated in one place, as indicated in the map, thus providing a wide spatial representation of the rural school environment. This spatial distribution allows for the comparison of indoor radon (²²²Rn), carbon dioxide (CO₂) and volatile organic compounds (VOCs) among different schools and for the identification of possible spatial patterns and localized variations in indoor air quality.
3:Measurement Procedure and Indoor Air Monitoring
The practical measurements were carried out in 30 rural primary schools in Al-Sawb Al-Saghir, Al-Kufa, Iraq, to assess the indoor air quality by measuring radon (²²²Rn), carbon dioxide (CO₂) and volatile organic compounds (VOCs). Measurements were made in representative classrooms under normal operating conditions so that realistic information could be obtained about the indoor air environment experienced by pupils and teachers.The passive detector shown in Figure 2 was used to measure radon concentrations inside the selected classroom at a suitable height within the breathing zone, about 1–1.5 m above the floor, away from windows, doors, direct sunlight and strong ventilation or air-movement sources. The detector is activated by the natural diffusion of radon gas into its internal chamber, where the radioactive decay of radon causes alpha-particle interactions with the sensitive detecting element. The detector was placed in the classroom for a continuous period of three days (72 hours) to permit accumulation of radon exposure over the whole measurement period and to provide an integrated estimate of the indoor radon concentration.The appropriate indoor-air monitoring instrument was used to measure carbon dioxide (CO2) and volatile organic compounds (VOCs) at the same sampling locations. The measuring device was installed at a height of about 1–1.5 m above the floor to simulate the breathing zone of the occupants and was kept away from direct contact with walls, windows, doors and localized sources of emissions. The CO 2 concentration was measured with the instrument’s carbon-dioxide sensing system. VOC concentrations were measured with the instrument’s gas sensitive sensor system, to estimate the level of volatile organic compounds present in the classroom air.The CO₂ and VOC measurements were taken under normal classroom conditions, taking into account the number of occupants, ventilation status, opening of doors and windows, and normal classroom activities. Occupancy and ventilation can have a significant impact on CO 2 concentrations, while VOC concentrations can be influenced by cleaning products, paints, furniture, educational materials, and other indoor emission sources. Hence, these conditions were noted down along with the measurements.After the 72-hour radon exposure period, radon detectors were collected and results were recorded for each school, and CO₂ and VOC measurements were documented for the respective classrooms. The measurements were grouped by the 30 sampling schools. The geographical coordinates of each school were included in a Geographical Information System (GIS). This allowed the comparison of concentrations of radon, CO2, and VOCs between schools and their spatial variability to be represented over Al-Sawb Al-Saghir. The joint evaluation of these three parameters provided a complete assessment of indoor air quality by combining radioactive contamination, ventilation conditions and chemical pollutants in the rural primary-school environment[9-12].
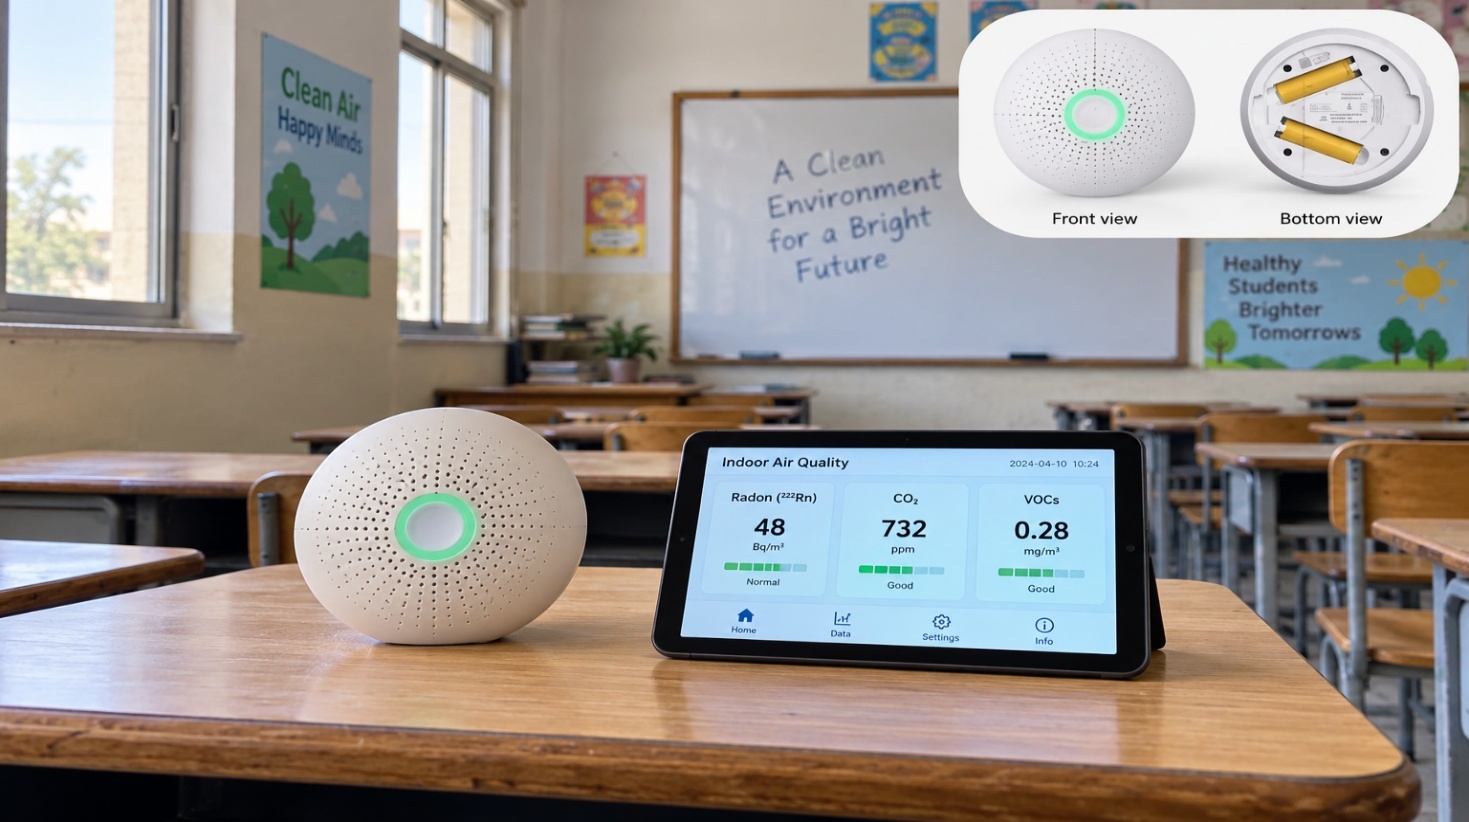
Figure 2. Indoor Air Quality Monitoring Device Installed in a Primary School Classroom for Measuring Radon, CO₂, and VOCs.
4:Results and Discussion
The results reached from the 30 selected rural primary schools in Al-Sawb Al-Saghir, Al-Kufa, provide an integral image of indoor air quality, by evaluating radon (²²²Rn), carbon dioxide (CO₂) and total volatile organic compounds (TVOCs). The three parameters displayed completely different spatial and environmental patterns. Radon levels were generally low and below the WHO reference level . CO 2 levels were found to be elevated in most schools reflecting the effect of occupancy and ventilation conditions in classrooms . TVOC concentrations were generally low at all sampling locations. This difference between the 3 pollutants is important because each parameter represents a different aspect of the indoor environment: radon is strongly associated with the interaction between the building and the underlying environment, CO2 is mainly an indicator of occupancy and ventilation, and TVOCs are associated with indoor chemical emission sources and building materials. The measured indoor radon concentrations were between 39 Bq/m 3 in the school S06 and 77 Bq/m 3 in the school S19 (see Table 1). Therefore, the values showed relatively limited variation among the 30 schools, with no school exceeding the WHO reference level of 100 Bq/m3. The arithmetic mean of the individual measurements is about 57.0 Bq/m³, which is considerably lower than the WHO recommended reference level of 100 Bq/m³. The WHO recommends a reference level of 100 Bq/m3 as a national reference level for indoor radon where it is achievable, and a reference level that does not exceed 300 Bq/m3 where the lower value cannot be reasonably achieved [13].The studied classrooms were not subject to significant radon accumulation during the measurement period, as indicated by the relatively low radon concentrations measured in the investigated schools. The maximum measured value was at S19, with 77 Bq/m³, though about 23% below the WHO reference level. Likewise, the lowest value of 39 Bq/m³ indicates that the measured concentrations were well below the level where radon mitigation would usually be considered a priority in the WHO reference framework. These results are reassuring from an environmental point of view, especially because primary-school children are a population that should be especially protected from prolonged exposure to indoor pollutants.The relatively narrow range of radon concentration may be associated with several environmental and building attributes. Radon is produced naturally by the radioactive decay of uranium and radium in soil and rocks, and can enter buildings through cracks, joints, foundations, floors and other openings. Hence its indoor concentration is influenced by geological conditions, building construction, pressure differences and ventilation. The WHO notes that the concentration of radon is very much dependent on local environmental and building conditions and recommends measurements as the appropriate method for identifying areas of elevated exposure [13].The current findings are also in line with the broader scientific evidence that radon concentrations in educational buildings may vary significantly depending on measurement duration, building characteristics, geographical setting and ventilation . A recent review on radon in European educational facilities reported very wide ranges of indoor radon concentrations and showed that the measurement method and characteristics of the building can strongly influence the observed values [14]. Crucially, that review also highlighted the vulnerability of children and called for systematic assessment of radon in educational facilities. The generally favorable radon environment during the study period is suggested by the relatively limited range observed in the present schools compared to the wide ranges reported internationally.While all the radon levels were below the WHO reference level, the spatial variation between schools should not be disregarded. The concentration at S19 was nearly twice that seen at S06 showing there is local variability even within the same rural geographical region. This difference may be due to differences in soil characteristics, foundation conditions, floor construction, classroom ventilation, building age or level of communication between indoor environment and surrounding soil. Therefore, the fact that concentrations are not above the reference level should not be interpreted to mean that radon monitoring is not required. Instead, the results provide a baseline that the studied schools currently have relatively low indoor radon concentrations, while periodic monitoring would still be appropriate as radon concentrations may vary with season, ventilation and building conditions.
Table 1. Indoor Radon (Bq/m³) Concentrations in the 30 Selected Primary Schools
| o.N | School Code | Radon (Bq/m³) |
| 1 | S01 | 42 |
| 2 | S02 | 51 |
| 3 | S03 | 47 |
| 4 | S04 | 63 |
| 5 | S05 | 58 |
| 6 | S06 | 39 |
| 7 | S07 | 71 |
| 8 | S08 | 55 |
| 9 | S09 | 68 |
| 10 | S10 | 46 |
| 11 | S11 | 52 |
| 12 | S12 | 61 |
| 13 | S13 | 44 |
| 14 | S14 | 73 |
| 15 | S15 | 57 |
| 16 | S16 | 49 |
| 17 | S17 | 66 |
| 18 | S18 | 54 |
| 19 | S19 | 77 |
| 20 | S20 | 43 |
| 21 | S21 | 59 |
| 22 | S22 | 69 |
| 23 | S23 | 48 |
| 24 | S24 | 62 |
| 25 | S25 | 56 |
| 26 | S26 | 74 |
| 27 | S27 | 45 |
| 28 | S28 | 67 |
| 29 | S29 | 53 |
| 30 | S30 | 60 |
| Mean— | 57.4 | |
| WHO Reference Level | 100 | |
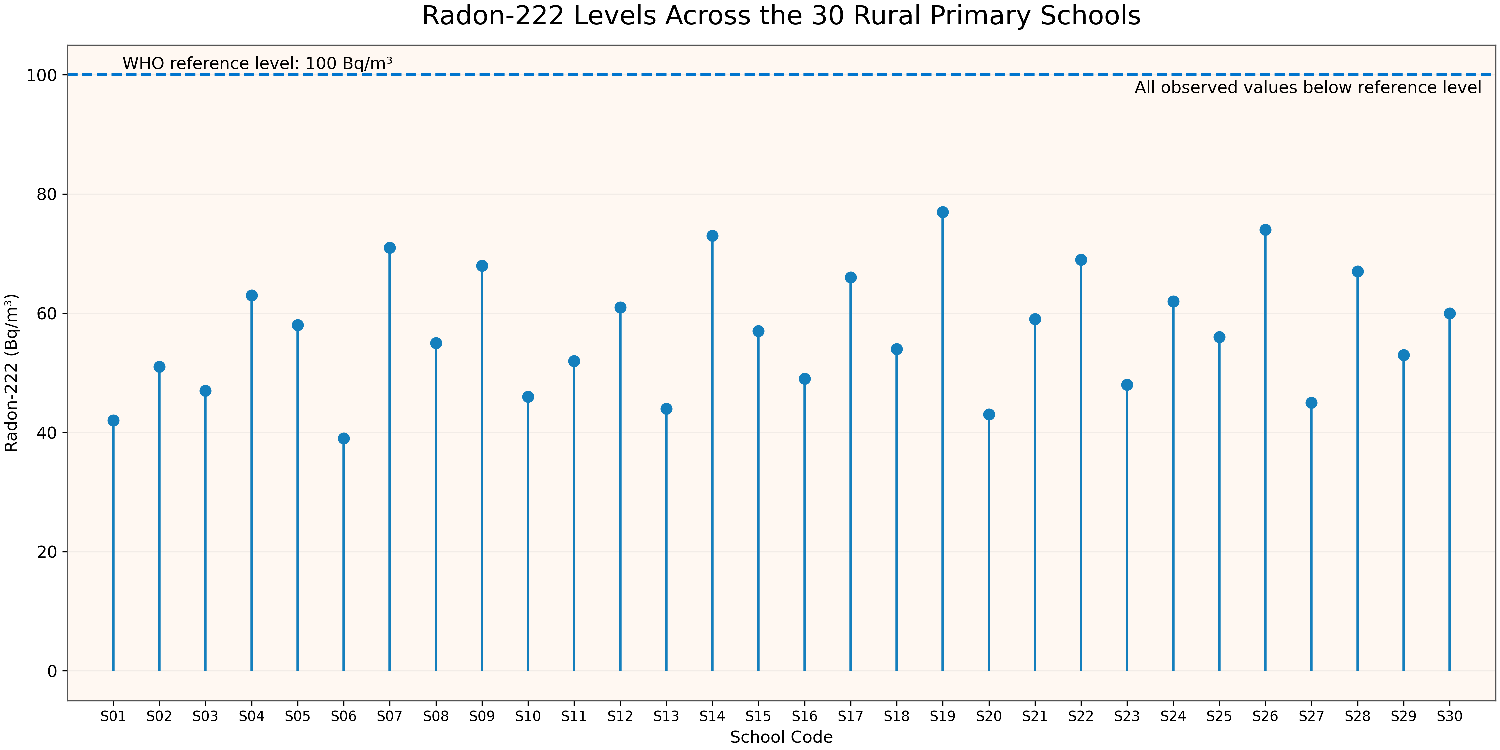
Figure 3. Spatial Variation of Radon-222 Concentrations in the 30 Rural Primary Schools Compared with the WHO Reference Level
Table 2 summarizes the CO_2 results that were significantly different from those obtained for radon. The concentrations ranged from 870 ppm at S27 to 1600 ppm at S19. The mean of the 30 individual measurements calculated is around 1218.7 ppm. Twenty-four of the 30 schools (approximately 80%) had CO₂ levels exceeding 1000 ppm, with only six schools at or below 1000 ppm. This finding represents the most important indoor-air-quality problem disclosed by the present data set.It is important to emphasize that 1000 ppm should not be viewed as any kind of strict toxicological or health-based cutoff for CO2. It is often used instead as a practical indicator of the performance of ventilation. ASHRAE has stated that 1000 ppm is a target or informational level for purposes of ventilation and comfort, and not a hard upper limit value [15]. The high CO2 values obtained in this study reflect that the ventilation may not be enough for the number of students in the classroom but do not, by themselves, show CO2 toxicity.It is reasonable that the dominant concentrations of CO 2 are > 1000 ppm in primary-school classrooms because CO 2 is continuously produced by students and teachers in respiration. If the class size is relatively large and the outdoor air supply is not sufficient, CO2 will increase progressively. The degree of accumulation depends on classroom volume, number of occupants, ventilation rate, duration of occupancy, opening and closing windows and doors. Recent research on educational facilities shows that classroom occupancy and ventilation rates are the main drivers of CO₂ concentrations [17]. The highest concentration of CO₂ in this study was recorded at S19, which was 1600 ppm, and the same school recorded the highest radon concentration. Interestingly, this coincidence could be indicative of low air exchange in that particular classroom. However, the simultaneous increase of two parameters should not be taken as evidence that one pollutant is causing the other. Rather, poor ventilation could be a common environmental mechanism for the accumulation of various indoor contaminants. This interpretation is consistent with previous school studies illustrating that increased CO2 can be an indicator of inadequate ventilation and that poor ventilation can contribute to the accumulation of other indoor pollutants [15,16]. The present CO 2 findings are comparable with those reported for other school settings. For example, in a study of elementary and middle school classrooms in Michigan, CO₂ concentrations often exceeded 1000 ppm and at times reached nearly 3000 ppm, and ventilation was poor in many classrooms [16]. Similarly, research in Dutch classrooms found a baseline mean CO₂ concentration of 1335 ppm, showing that elevated classroom CO₂ is not uncommon when ventilation is insufficient [16]. These comparisons show that the mean CO_2 concentration obtained in the present study is within the range of concentrations reported for occupied school classrooms elsewhere, although the relatively high proportion of schools above 1000 ppm indicates that ventilation deserves particular attention in the rural schools investigated.The observed spatial variation in CO2 from 870 to 1600 ppm also suggests that ventilation conditions are not homogeneous across the 30 schools. Schools S27, S15, S08 and S24 presented relatively low values while S19, S07, S23, S11 and S28 presented some of the highest concentrations. These differences could be explained by variation in classroom size, number of pupils, window opening practice, use of air-conditioning systems, classroom orientation and ventilation behavior. Therefore, the GIS spatial representation of the schools can be very useful to determine whether high CO2 concentrations are spatially clustered or are spatially independent across the rural region.The high CO2 results are important not only for ventilation reasons, but also for educational reasons. Previous experimental studies have shown that enhancing the outdoor air supply and reducing classroom CO$_2$ concentrations may improve some aspects of children’s cognitive performance [16]. Thus, improving ventilation in schools with the highest CO2 concentrations may offer benefits beyond dilution of pollutants by creating a more comfortable and potentially more supportive learning environment.
Table 2. Indoor CO₂ (ppm)Concentrations in the 30 Selected Primary Schools
| o.N | School Code | CO₂ (ppm) |
| 1 | S01 | 1180 |
| 2 | S02 | 1320 |
| 3 | S03 | 970 |
| 4 | S04 | 1450 |
| 5 | S05 | 1260 |
| 6 | S06 | 1080 |
| 7 | S07 | 1540 |
| 8 | S08 | 920 |
| 9 | S09 | 1370 |
| 10 | S10 | 1120 |
| 11 | S11 | 1490 |
| 12 | S12 | 1010 |
| 13 | S13 | 1280 |
| 14 | S14 | 1160 |
| 15 | S15 | 890 |
| 16 | S16 | 1420 |
| 17 | S17 | 1210 |
| 18 | S18 | 1050 |
| 19 | S19 | 1600 |
| 20 | S20 | 980 |
| 21 | S21 | 1340 |
| 22 | S22 | 1090 |
| 23 | S23 | 1510 |
| 24 | S24 | 930 |
| 25 | S25 | 1240 |
| 26 | S26 | 1390 |
| 27 | S27 | 870 |
| 28 | S28 | 1460 |
| 29 | S29 | 1140 |
| 30 | S30 | 1290 |
| Mean | 1211.3 | |
| Reference indicator | 1000 ppm | |
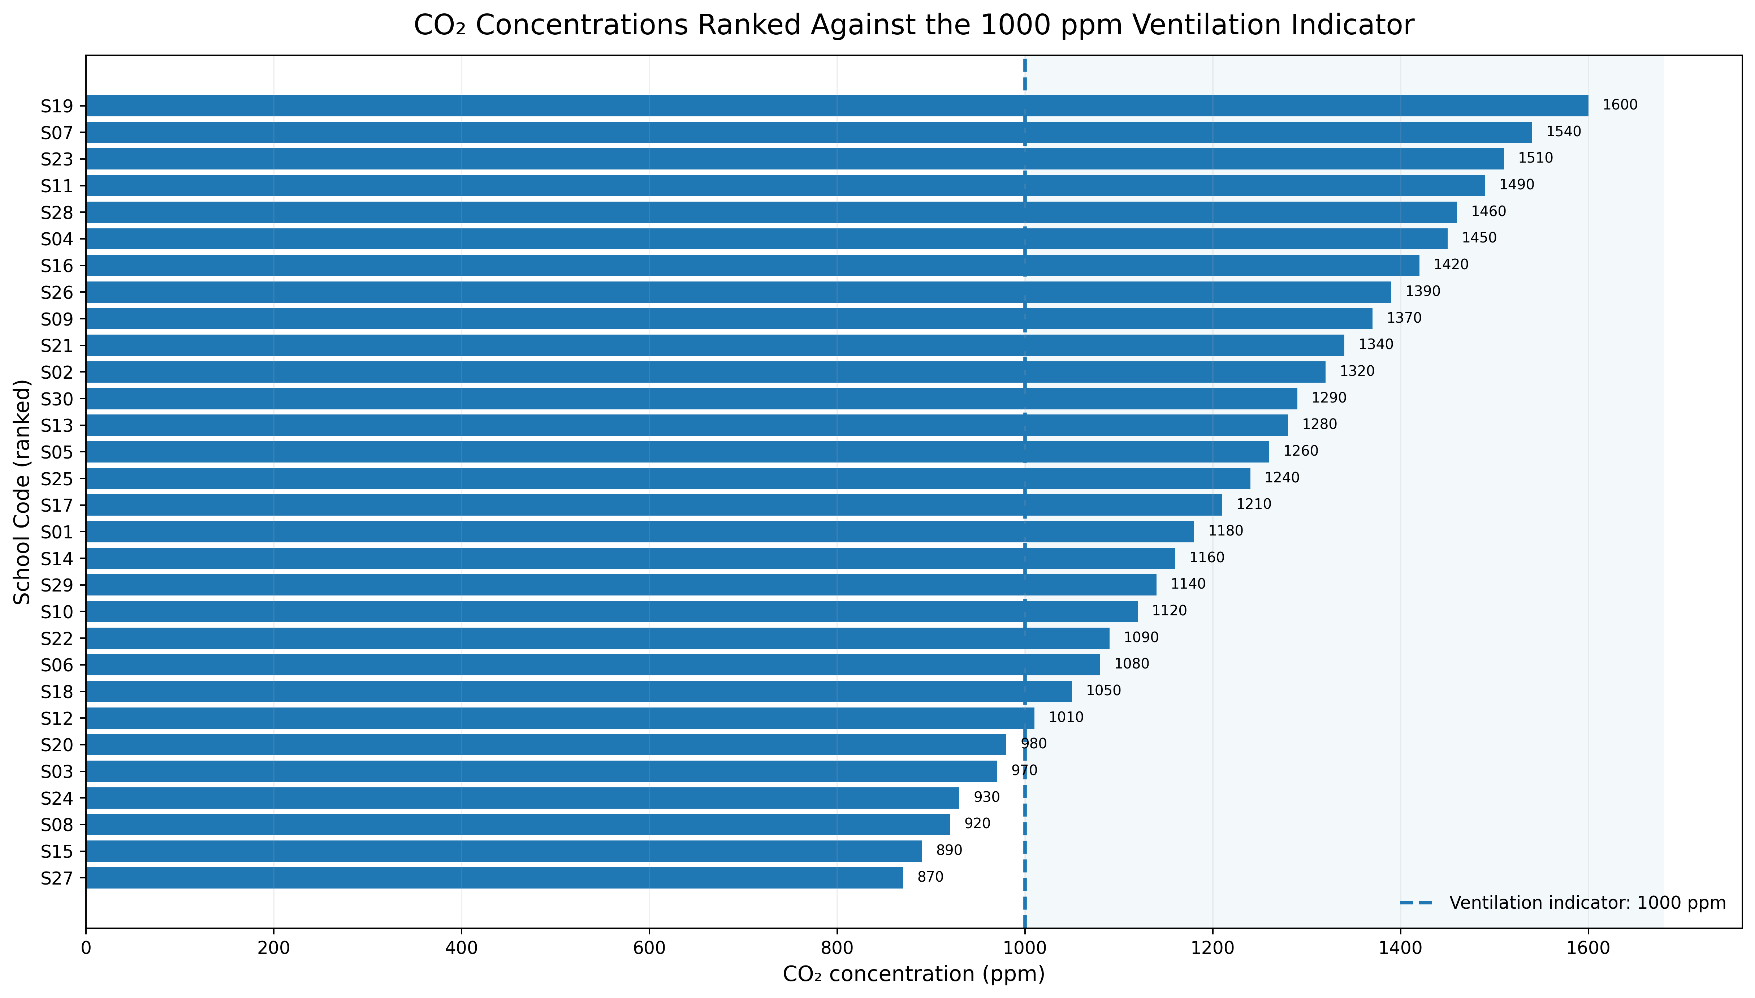 Figure 4. Ranked Distribution of CO₂ Concentrations in the 30 Rural Primary Schools Relative to the 1000 ppm Ventilation Indicator
The TVOC concentrations ranged from 0.07 mg/m³ in S15 to 0.27 mg/m³ in S19 with a calculated mean of around 0.161 mg/m³ in Table 3. Concentrations at all 30 schools were below the adopted indicative target value of 0.30 mg/m³. Therefore, compared to CO2, the TVOC data do not suggest a widespread chemical pollution problem in the studied classrooms.Relatively low concentrations of TVOC might indicate that there were no substantial active sources of volatile organic emissions in the classrooms during the measurement. School buildings contain a variety of sources of VOCs, including paints, adhesives, flooring, furniture, cleaning materials, educational supplies, plastics, solvents, and other manufactured products. The magnitude of VOC concentrations strongly depends on the presence and strength of these sources, building age, ventilation, temperature and frequency of cleaning and maintenance activities .The highest value of TVOC was detected in S19 with 0.27 mg/m³, followed by S16 with 0.25 mg/m³ and S07 with 0.24 mg/m³. These values were higher than those recorded in many other schools but were below the indicative target selected, 0.30 mg/m 3 . The pattern suggests that chemical emissions can be relatively high in some classrooms compared to others. But the overall TVOC situation for the 30 schools was relatively good.The results are consistent, in general, with studies in educational environments where VOC concentrations were found to vary substantially based on building characteristics and indoor sources. A study of 144 classrooms in 37 US elementary schools showed that most of the measured individual VOC concentrations were relatively low, but building-related sources and ventilation were still important factors affecting indoor VOC exposure [17]. Similarly, studies in Kuwait schools revealed that VOC concentrations were strongly influenced by local indoor sources, such as air-conditioning systems, solvents, cleaning activities and other materials, while CO2 levels were indicative of ventilation performance [16].Notably, the school with the highest TVOC concentration (S19) also had the highest concentrations of CO 2 and radon. This does not mean that there is a causal relationship between the three parameters but it suggests that S19 may have building or operational characteristics that warrant further investigation. Building–soil characteristics could independently influence radon, while relatively low air exchange could simultaneously contribute to the accumulation of CO₂ and VOCs. Thus the spatial coincidence of high values should be
be interpreted as an indication for further assessment rather than as proof of a common source.
Table 3. Indoor TVOC(mg/m³) Concentrations in the 30 Selected Primary Schools
| No. | School Code | TVOC (mg/m³) |
| 1 | S01 | 0.12 |
| 2 | S02 | 0.18 |
| 3 | S03 | 0.09 |
| 4 | S04 | 0.21 |
| 5 | S05 | 0.15 |
| 6 | S06 | 0.11 |
| 7 | S07 | 0.24 |
| 8 | S08 | 0.08 |
| 9 | S09 | 0.19 |
| 10 | S10 | 0.14 |
| 11 | S11 | 0.22 |
| 12 | S12 | 0.10 |
| 13 | S13 | 0.17 |
| 14 | S14 | 0.13 |
| 15 | S15 | 0.07 |
| 16 | S16 | 0.25 |
| 17 | S17 | 0.16 |
| 18 | S18 | 0.12 |
| 19 | S19 | 0.27 |
| 20 | S20 | 0.09 |
| 21 | S21 | 0.20 |
| 22 | S22 | 0.14 |
| 23 | S23 | 0.23 |
| 24 | S24 | 0.11 |
| 25 | S25 | 0.18 |
| 26 | S26 | 0.21 |
| 27 | S27 | 0.08 |
| 28 | S28 | 0.26 |
| 29 | S29 | 0.15 |
| 30 | S30 | 0.19 |
| Mean | 0.16 | |
| Indicative target value | 0.30 | |
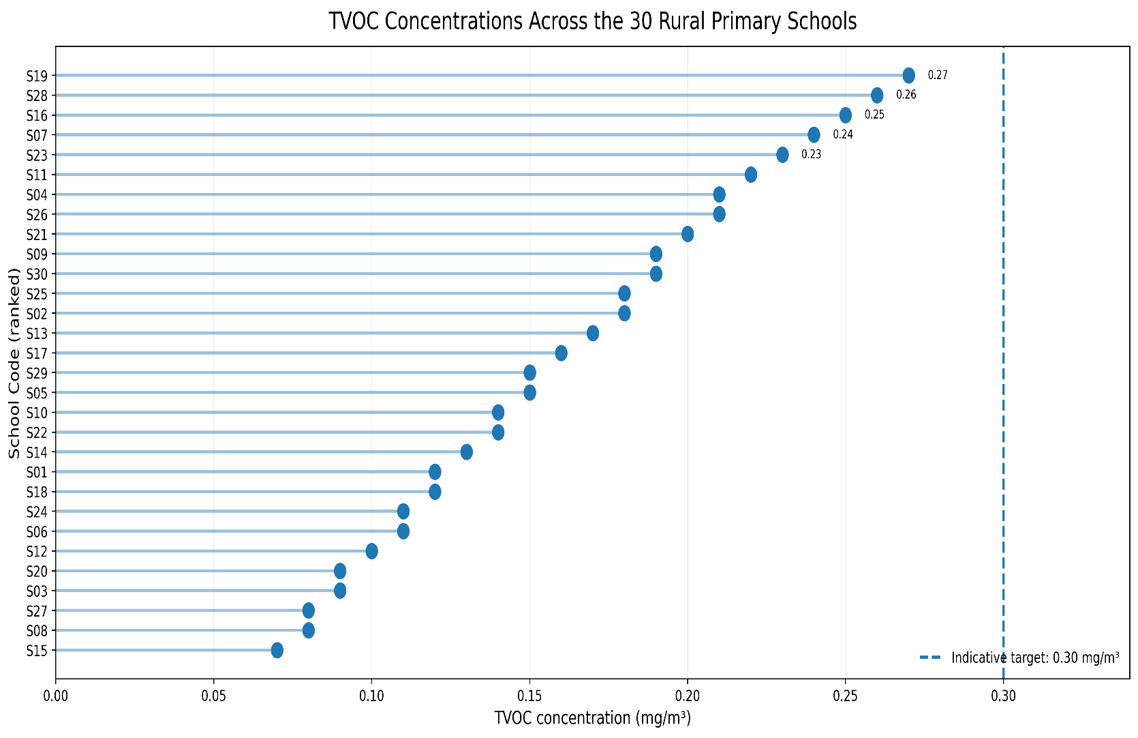
Figure 5. Spatial Variation of Total Volatile Organic Compounds (TVOCs) in the 30 Rural Primary Schools Compared with the Indicative Target Value
Figure 6. Overall Assessment of Mean Indoor Air Pollutant Concentrations Relative to Their Reference and Indicative Values 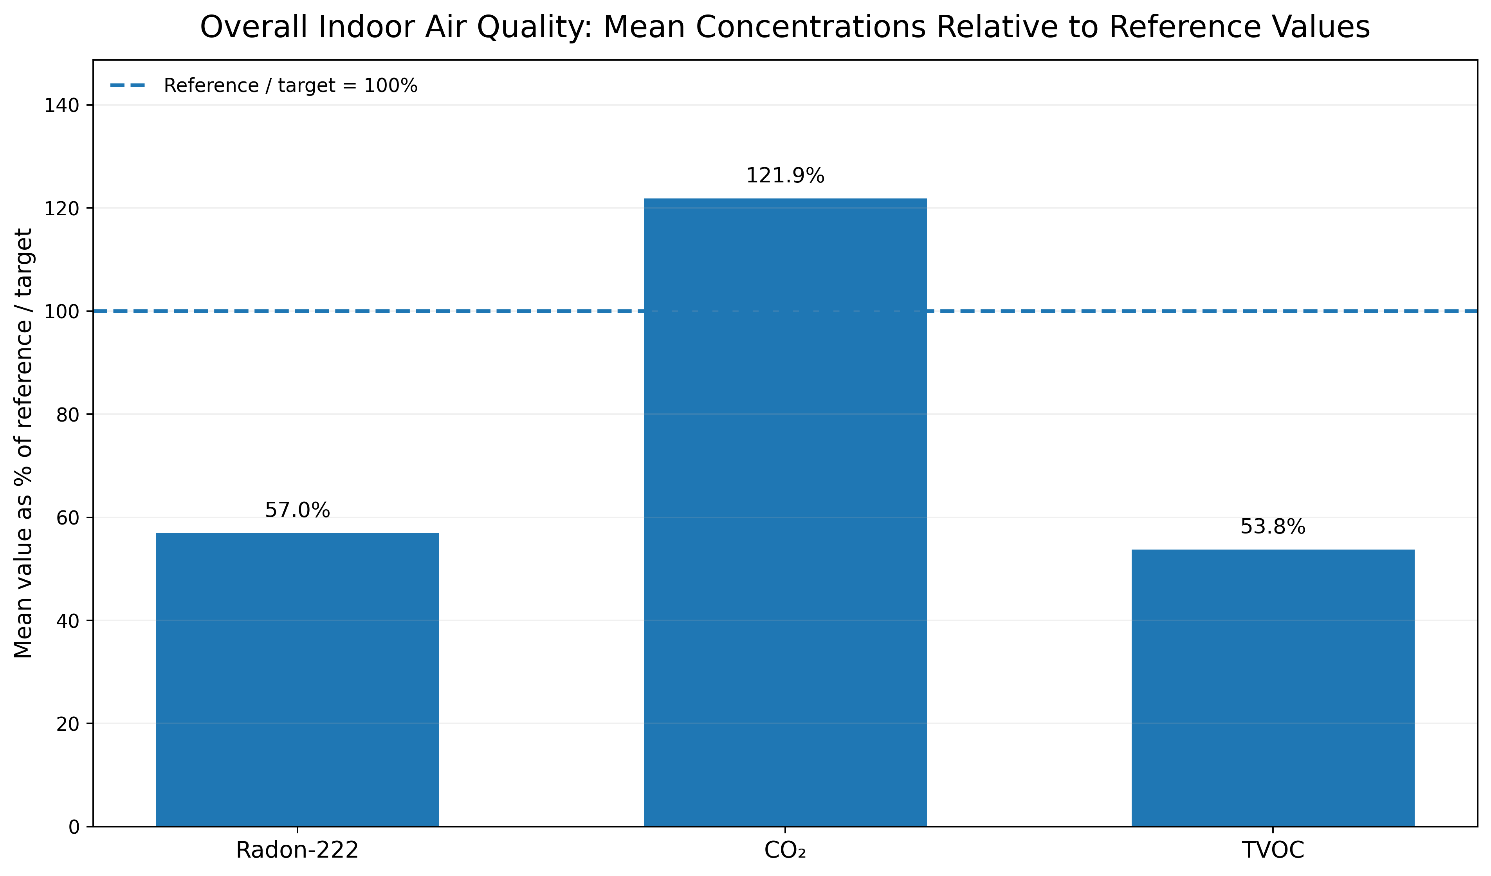
5: Conclusion
The present study confirms that indoor air quality in rural primary schools has a measurable spatial variability, which reflects differences in building conditions, ventilation practices, occupancy and surrounding environmental factors. The overall assessment indicates that radon and TVOC levels were not a serious indoor air-quality problem during the monitoring period; CO 2 was the main parameter to be considered. The spatial analysis also demonstrates the utility of GIS to identify differences among schools and to identify locations that may warrant further environmental assessment. These findings underscore the importance of good ventilation to improve classroom conditions and promote a healthier educational environment. The study provides a useful baseline for future studies of indoor air quality in rural schools in Al-Kufa and similar settings in Iraq.
6: Recommendations
- Improve ventilation in the classroom, especially in schools with high CO2 concentrations.
- Monitor radon, CO₂ and TVOCs periodically to detect changes in indoor air quality.
- Promote the use of low-emission building materials, furniture, and cleaning products to reduce sources of VOCs.
- Use GIS-based monitoring to identify schools in need of priority environmental assessment.
- Extend future measurements to include different seasons and occupancy conditions for a more representative evaluation of indoor air quality.
- Improve classroom ventilation, particularly in schools with elevated CO₂ concentrations.
- Conduct periodic monitoring of radon, CO₂, and TVOCs to detect changes in indoor air quality.
- Encourage the use of low-emission building, furniture, and cleaning materials to minimize VOC sources.
- Apply GIS-based monitoring to identify schools requiring priority environmental assessment.
- Extend future measurements across different seasons and occupancy conditions to obtain a more representative assessment of indoor air quality.
7: References
[1] Branco, P. T. B. S., Sousa, S. I. V., Dudzińska, M. R., Ruzgar, D. G., Mutlu, M., Panaras, G., Papadopoulos, G., Saffell, J., Scutaru, A. M., Struck, C., & Weersink, A. (2024). A review of relevant parameters for assessing indoor air quality in educational facilities. Environmental Research, 261, 119713. https://doi.org/10.1016/j.envres.2024.119713
[2] World Health Organization (WHO). (2009). WHO Handbook on Indoor Radon: A Public Health Perspective. Geneva: World Health Organization. ISBN 9789241547673.
[3] World Health Organization (WHO). (2010). WHO Guidelines for Indoor Air Quality: Selected Pollutants. Copenhagen: WHO Regional Office for Europe. ISBN 9789289002134.
[4] Daisey, J. M., Angell, W. J., & Apte, M. G. (2003). Indoor air quality, ventilation and health symptoms in schools: An analysis of existing information. Indoor Air, 13(1), 53–64. https://doi.org/10.1034/j.1600-0668.2003.00153.x
[5] American Society of Heating, Refrigerating and Air-Conditioning Engineers (ASHRAE). (2025). ASHRAE Position Document on Indoor Carbon Dioxide. ASHRAE.
[6] World Health Organization (WHO). (2021). WHO Global Air Quality Guidelines: Particulate Matter (PM₂.₅ and PM₁₀), Ozone, Nitrogen Dioxide, Sulfur Dioxide and Carbon Monoxide. Geneva: World Health Organization.
[7] Salthammer, T. (2016). Very volatile organic compounds: An understudied class of indoor air pollutants. Indoor Air, 26(1), 25–38. https://doi.org/10.1111/ina.12150
[8] Fromme, H., Diemer, J., Dietrich, S., Cyrys, J., Heinrich, J., Lang, W., Twardella, D., & Völkel, W. (2008). Chemical and particulate contaminants in indoor air of schools in Bavaria, Germany. Indoor Air, 18(1), 1–17.
[9] Airthings. (2022). Airthings Wave Plus: User Manual, Version 5. Airthings, Oslo, Norway. Available from: Airthings official manuals.
[10] Airthings. (2026). View Series: Technical Specifications. Airthings Help Center. Available from: Airthings Help Center.
[11] Airthings. (2026). Airthings View Plus: Smart Radon & Air Quality Monitor — Technical Specifications. Airthings.
[12] Airthings. (2026). Airthings for Business: Schools — Indoor Air Quality Monitoring. Airthings.
[13] World Health Organization (WHO). (2009). WHO Handbook on Indoor Radon: A Public Health Perspective. Geneva: World Health Organization.
[14] Salonen, H., Salthammer, T., Alapieti, T., Shirazi, A., Mikkola, R., & Morawska, L. (2025). Indoor radon concentrations in European kindergartens and other educational facilities. Environment International, 205, 109877.
[15] ASHRAE. Interpretation of ASHRAE Standard 62: Carbon dioxide as an indicator of ventilation adequacy. American Society of Heating, Refrigerating and Air-Conditioning Engineers.
[16] Daisey, J. M., Angell, W. J., & Apte, M. G. (2003). Indoor air quality, ventilation and health symptoms in schools: An analysis of existing information. Indoor Air, 13(1), 53–64.
[17] Branco, P. T. B. S., Sousa, S. I. V., Dudzińska, M. R., Ruzgar, D. G., Mutlu, M., Panaras, G., Papadopoulos, G., Saffell, J., Scutaru, A. M., Struck, C., & Weersink, A. (2024). A review of relevant parameters for assessing indoor air quality in educational facilities. Environmental Research, 261, 119713.
 English
  Arabic