
Selective Catalytic Pyrolysis of Polyethylene Waste into Transportation Fuels via Tailored Mesoporous–Acidic Catalysts
التحلل الحراري التحفيزي الانتقائي لنفايات البولي إيثيلين إلى وقود النقل باستخدام حفّازات حمضية مسامية متوسطة مُصمَّمة خصيصًا
Basheir Mohammed Mustafa Abdellah1*, Ibrahim Hassan Mohamed Elamin2
1 Department of Chemical Engineering, University of Science and Technology, Khartoum, Sudan
2 Department of Chemical Engineering, University of Science and Technology, Khartoum, Sudan
*Corresponding author e-mail: mohammed_basheir@yahoo.com
DOI: https://doi.org/10.53796/hnsj72/31
Arabic Scientific Research Identifier: https://arsri.org/10000/72/31
Volume (7) Issue (2). Pages: 523 - 541
Received at: 2026-01-10 | Accepted at: 2026-01-20 | Published at: 2026-02-01
Abstract: The rapid accumulation of polyethylene-based plastic waste presents a dual environmental challenge and an underutilized carbon resource. In this study, a selective catalytic pyrolysis strategy is developed to convert LDPE, LLDPE, and HDPE into targeted transportation fuels by rational catalyst design. Three mesoporous–acidic catalysts with distinct structural and chemical functionalities (Ru–MCM-41/ZrO₂, ZrO₂/ZSM-5/Fe₃O₄, and Co–Mo–Ni–MCM-41/Al₂O₃) were synthesized via sol–gel routes and evaluated under identical reaction conditions. Product selectivity was governed by catalyst composition, metal functionality, and pore architecture, as inferred from textural properties and catalytic performance trends. Ru–MCM-41/ZrO₂ exhibited a product distribution dominated by (C8 – C16) jet-range hydrocarbons, suggesting moderate cracking severity compared to the other catalysts, ZrO₂/ZSM-5/Fe₃O₄ enhanced (C4 – C12) gasoline formation through intensified β-scission and isomerization, while Co–Mo–Ni–MCM-41/Al₂O₃ promoted (C12 – C20) diesel-range fractions via moderated cracking of long-chain intermediates. The resulting fuels exhibited physicochemical properties comparable to refinery-derived counterparts. This work demonstrates that catalyst-driven selectivity enables direct production of fuel-specific fractions from plastic waste, providing a scalable and conceptually transferable pathway for waste-to-energy conversion.
Keywords: Polyethylene waste, catalytic pyrolysis, mesoporous catalysts, fuel selectivity, gasoline, diesel, jet fuel.
المستخلص: يمثّل التراكم السريع للنفايات البلاستيكية المعتمدة على البولي إيثيلين تحديًا بيئيًا مزدوجًا، وفي الوقت نفسه موردًا كربونيًا غير مستغل على نحو كافٍ. في هذه الدراسة، تم تطوير استراتيجية للتحلل الحراري التحفيزي الانتقائي لتحويل كل من البولي إيثيلين منخفض الكثافة (LDPE)، والبولي إيثيلين منخفض الكثافة الخطي (LLDPE)، والبولي إيثيلين عالي الكثافة (HDPE) إلى وقود مخصّص لقطاع النقل، وذلك من خلال تصميم عقلاني للمحفّزات. تم تحضير ثلاثة محفّزات حمضية مسامية متوسطة ذات خصائص بنيوية وكيميائية مميّزة (Ru–MCM-41/ZrO₂، وZrO₂/ZSM-5/Fe₃O₄، وCo–Mo–Ni–MCM-41/Al₂O₃) باستخدام طرائق السول–جيل، وتقييم أدائها تحت ظروف تفاعل متماثلة. وقد تبيّن أن انتقائية النواتج تحكمها تركيبة المحفّز، ووظائف المعادن، وبنية المسام، كما استُدل على ذلك من الخصائص النسيجية واتجاهات الأداء التحفيزي. أظهر محفّز Ru–MCM-41/ZrO₂ توزيعًا للمنتجات تهيمن عليه الهيدروكربونات ضمن مدى وقود الطائرات (C8–C16)، مما يشير إلى شدة تكسير معتدلة مقارنة بالمحفّزات الأخرى. في حين عزّز محفّز ZrO₂/ZSM-5/Fe₃O₄ تكوين البنزين ضمن مدى (C4–C12) عبر تكثيف تفاعلات الانشطار β والإيزومرة، بينما حفّز محفّز Co–Mo–Ni–MCM-41/Al₂O₃ تكوين كسور وقود الديزل ضمن مدى (C12–C20) من خلال تكسير معتدل للوسائط ذات السلاسل الطويلة. وقد أظهرت أنواع الوقود الناتجة خصائص فيزيائية–كيميائية مماثلة لتلك المستخلصة من المصافي النفطية التقليدية. وتبرهن هذه الدراسة أن الانتقائية المحكومة بالمحفّز تتيح الإنتاج المباشر لكسور وقودية محددة من النفايات البلاستيكية، مما يوفر مسارًا قابلاً للتوسع وذا قابلية انتقال مفاهيمي لتحويل النفايات إلى طاقة.
الكلمات المفتاحية: نفايات البولي إيثيلين، التحلل الحراري التحفيزي، الحفّازات المسامية المتوسطة، انتقائية الوقود، البنزين، الديزل، وقود الطائرات.
1. Introduction
Plastic waste accumulation has emerged as a critical global environmental concern, driven primarily by the widespread use of polyolefin-based materials such as polyethylene. Conventional disposal routes, including landfilling and uncontrolled combustion, result in persistent pollution and the loss of valuable hydrocarbon resources. In parallel, increasing pressure on fossil fuel reserves has motivated research into alternative carbon feedstocks for fuel production.
Thermal pyrolysis of polyethylene is a well-established approach; however, it typically produces a broad and poorly controlled hydrocarbon distribution, necessitating extensive downstream upgrading. Catalytic pyrolysis offers a promising alternative by enabling lower reaction temperatures and improved product selectivity. Despite significant progress, precise control over fuel-range selectivity—directing products toward gasoline, diesel, or jet fuel fractions—remains a major challenge.
Recent studies have highlighted the importance of catalyst acidity, pore size distribution, and metal functionality in governing polymer chain scission pathways. Nevertheless, most reported systems emphasize overall liquid yield rather than intrinsic selectivity toward specific transportation fuels. Addressing this gap requires catalyst architectures that directly control cracking severity and secondary reactions.
Herein, we propose a catalyst-driven selectivity strategy for polyethylene pyrolysis. By designing mesoporous–acidic catalysts with tailored structural and chemical features, we demonstrate controlled conversion of LDPE, LLDPE, and HDPE into gasoline-, diesel-, and jet-range hydrocarbons under identical operating conditions. The relationship between catalyst properties and product distribution is systematically analyzed, and the resulting fuels are benchmarked against conventional refinery products.
Unlike previous studies on ZSM-5 and MCM-41 which focuses primarily on maximizing liquid yield, this work emphasizes tailored mesoporous acidic catalysts to selectively control the distribution of transportation of fuel ranges (gasoline, jet, diesel) from polyethylene pyrolysis. The direct correlation between catalyst structural properties (porosity, acidity) and product selectivity distinguishes this approach from earlier catalytic systems.
2. Experimental Section
2.1 Materials
Post-consumer LDPE, LLDPE, and HDPE wastes were collected, cleaned, and shredded prior to use. Catalyst precursors included sodium silicate, zirconium oxide, aluminum oxide, cobalt nitrate, nickel nitrate, ammonium molybdate, ruthenium chloride, and hexadecyltrimethylammonium bromide (HDTAB), ammonia and Helium gases.
2.2 Catalyst Synthesis
Three catalysts were synthesized via sol–gel methods designed to achieve controlled mesoporosity and acidity:
Ru–MCM-41/ZrO₂: Prepared to combine mesoporous structure with moderate acidity and metal dispersion, aiming to limit secondary cracking.
ZrO₂/ZSM-5/Fe₃O₄: Designed to integrate strong Brønsted acidity and magnetic functionality, enhancing β-scission and isomerization reactions.
Co–Mo–Ni–MCM-41/Al₂O₃: Formulated to provide balanced acidity and hydrogen-transfer capability, favoring diesel-range hydrocarbons.
All catalysts were calcined in air to remove organic templates and stabilize the pore structure.
Ru-MCM-41/ZrO2: 5% Ru, ZrO2/ZSM-5/Fe3O4: 8% ZrO2 and 3% Fe3O4, Co-Mo-Ni-MCM-41/Al2O3 5% Co, 3% Mo, 2% Ni.
The pH during synthesis for Ru-MCM-41/ZrO2 is 10, for ZrO2/ZSM-5/Fe3O4 is 3, whereas for Co-Mo-Ni-MCM-41/Al2O3 is 6.
The ageing for Ru-MCM-41/ZrO2 is 18 h, for ZrO2/ZSM-5/Fe3O4 is 9 h, whereas for Co-Mo-Ni-MCM-41/Al2O3 is 21 h.
2.2.1 Impregnation conditions:
The solvent is a mixture of water and ethanol, the concentration is 1 M, the temperature 70o C, the stirring is slow.
2.3 Catalyst Characterization
Textural properties of the synthesized catalysts were evaluated by nitrogen adsorption-desorption measurements, at 77 K using a Micrometrics ASAP-type analyzer. Prior to analysis samples were degassed under vacuum at 300oC for 4h to remove physiosorbed species.
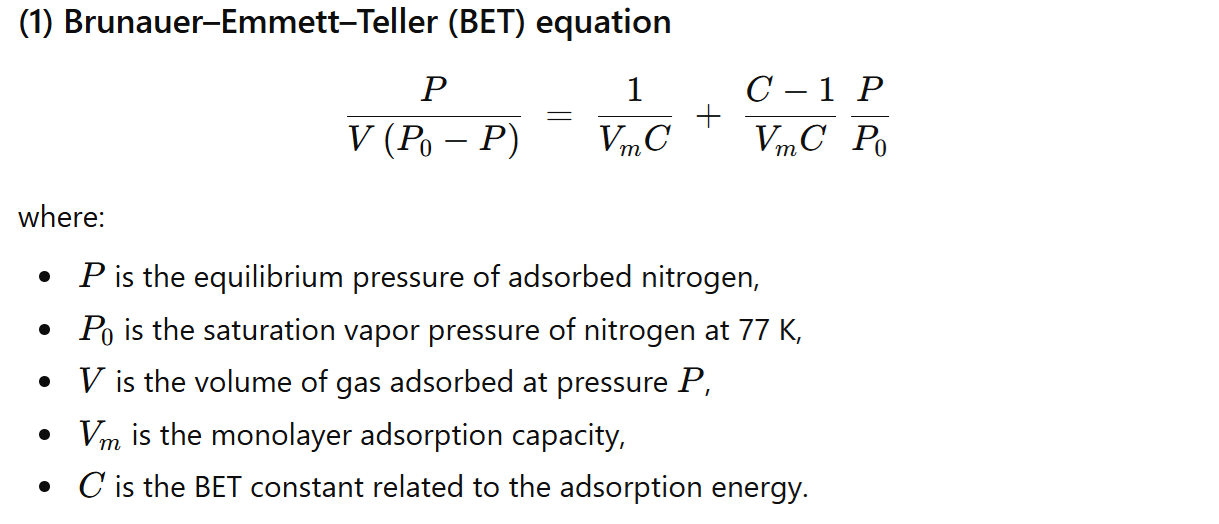
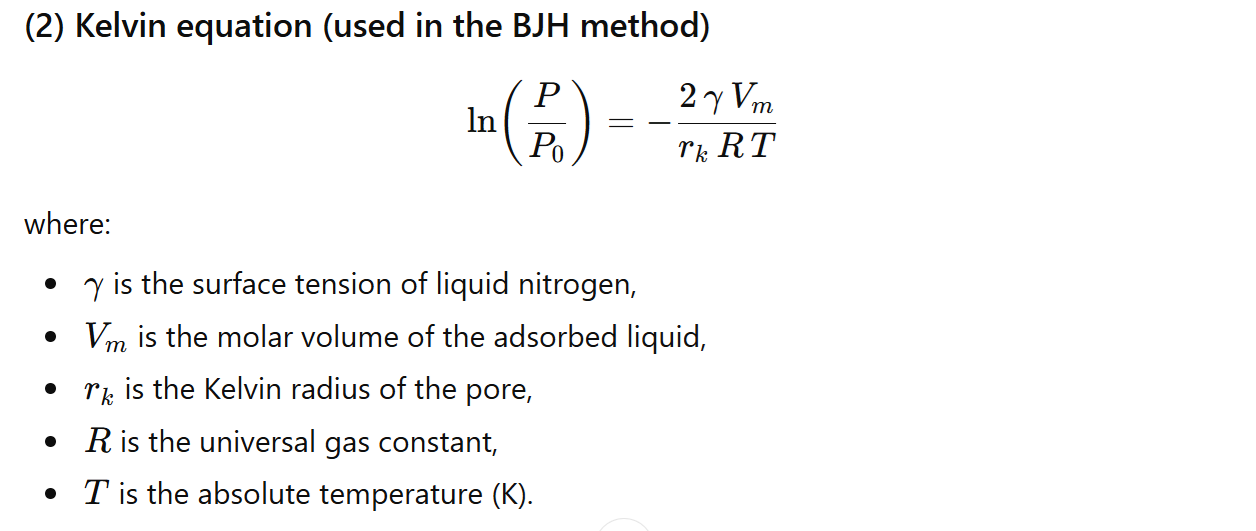
The specific surface area was calculated using the Brunauer-Emmett-Teller (BET) method in the relative pressure range of 0.05 to 0.3 by using equation 1 and MATLAB program, while pore size distributions and volume size distribution were derived from the desorption branch using the Barrett-Joyner-Halenda (BJH) model and estimated by Kelvin equation (equation2).
2.4 Acidity characteristics:
It was determined by temperature programmed desorption of ammonia (NH3-TPD). Approximately 100 mg of catalyst was pretreated under helium flow at 500 oC for 1 h, followed by ammonia adsorption at 100 oC. physisorbed NH3 was removed by flushing with helium and desorption was carried out from 100 to 800 oC at a heating rate of 10oC. The NH3 desorption profiles were used to qualitatively and semi-quantitatively asses total acidity and acid strength distribution.
Crystalline structure and phase composition were examined by X-ray diffraction (XRD) using Cu Kα radiation (λ = 1.5406oA) in the 2θ range of 5-80o. The diffraction patterns were used to confirm the presence of mesostructured silica frameworks and metal oxide phases, as well as to assess the degree of crystallinity of the ZSM-5 component.
2.4.1 Reusability:
The catalysts can be used reused several times depending on its stability
Ru-MCM-41/ZrO2 can be used up to four times, and ZrO₂/ZSM-5/Fe₃O₄ up three times, whereas Co-Mo-Ni-mcm-41/Al2O3 can be used up to five times. Using of each catalyst more than the mentioned times mentioned leads to loss the activity.
Catalyst activity is calculated by the following equation:
2.5 Catalytic Pyrolysis Experiments
Pyrolysis experiments were conducted in a fixed-bed stainless steel reactor under controlled heating (15 K min⁻¹) at 450°C. Each 1 kg of polyethylene type was processed at residence time 40 minutes using each catalyst under identical conditions to isolate catalyst effects. Condensed vapors were collected as liquid products, while non-condensable gases were vented.
The percentage of catalyst to polyethylene waste are 0.25:1 for all three types of the catalysts.
The experiment without catalyst produces one type of fuel whereas using catalysts produced different types of fuel.
2.6 Product Analysis
Liquid products were analyzed by GC–MS equipped with a non-polar DP-1 capillary column (30 m x 0.25 mm). Hydrocarbon fractions were classified based on carbon number distribution into gasoline (C5-C12), jet (C8-C16) and diesel (C12-C20) ranges following standard fuel classification criteria.
Selectivity is the ratio of the desired product to the total products formed. High selectivity indicates the catalyst’s efficiency i producing the desired product.
2.7 Measurements Techniques used:
1. Surface Area and Porosity Analysis:
- BET (Brunauer-Emmett-Teller): Measures surface area.
- BJH (Barrett-Joyner-Halenda): Pore size distribution.
2. Acidity Analysis:
- NH3-TPD (Temperature-Programmed-Desorption): Measures acidity ad acid site strength.
3. Structural Analysis:
- XRD (X-Ray Diffraction): Determines crystalline phase and particle size.
4. Product Analysis:
- GC-MS (Gas Chromatography- Mass Spectrometry): Identifies hydrocarbon product composition.
3. Results and Discussion
3.1 Catalyst Textural Properties
All catalysts exhibited high surface areas (500–800 m² g⁻¹) and microporous, mesoporous or mixture of microporous and mesoporous structures. Ru–MCM-41/ZrO₂ showed moderate pore diameters (1.2 to 18 nm) ad surface area of 600 m2/g conducive to controlled cracking and has medium acidity at peaks 0.3 and 0.4 mmol/g, while ZrO₂/ZSM-5/Fe₃O₄ displayed combined micro–mesoporosity (1.2 nm) and surface area of 800 m2/g, enhancing cracking severity has highest acidity and strongest acid site at peaks at 0.2, 0.42 and 0.64 mmol/g. Co–Mo–Ni–MCM-41/Al₂O₃ exhibited uniform mesopores (2 to 18 nm) and surface area of 500 m2/g suitable for long-chain hydrocarbon formation, has moderate acidity with hydrogen transfer capability at peak 0.5 mmol/g.
3.2 Structural and Acidity Considerations:
The NH3-TPD profiles revealed distinct acidity distributions among the catalysts. ZrO2/ZSM-5/Fe3O4 exhibited the highest total acidity and a significant fraction of strong acid sites, consistent with its enhanced gasoline-range selectivity via intensified β-scission reactions. XRD exhibited ZSM-5 diffraction pattern with ZrO2 and Fe3O4 nanoparticles.
In contrast Ru-MCM-41/ZrO2 showed predominately medium-strength acid sites, favoring controlled cracking and jet-range hydrocarbons. XRD exhibited MCM-41 diffraction pattern with Ru and ZrO2 nanoparticles on the surface.
Co-Mo-Ni-mcm-41/Al2O3 displayed moderate acidity combined with metal-assisted hydrogen transfer capability. Suppressing excessive cracking and promoting diesel-range fractions. XRD exhibited MCM-41 diffraction pattern with Co, Mo, and Ni nanoparticles on the surface.
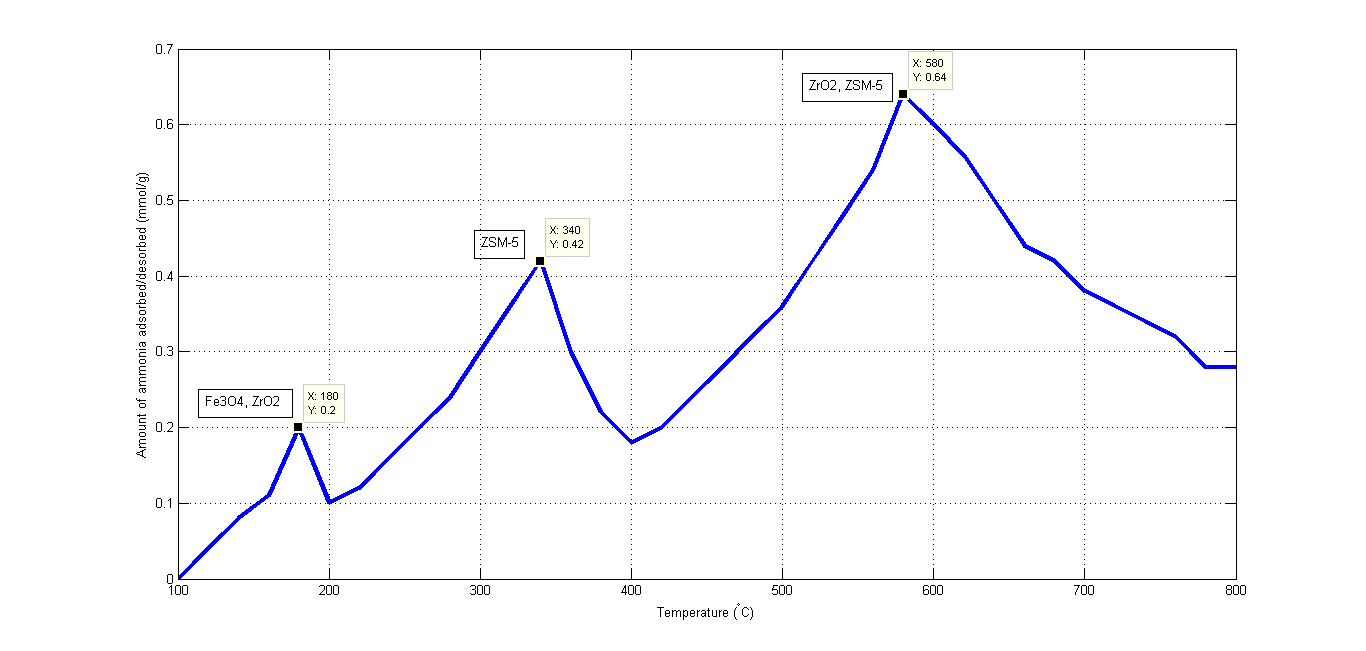
Figure 1. Acidity characteristics of the catalyst ZrO2/ZSM-5/Fe3O4
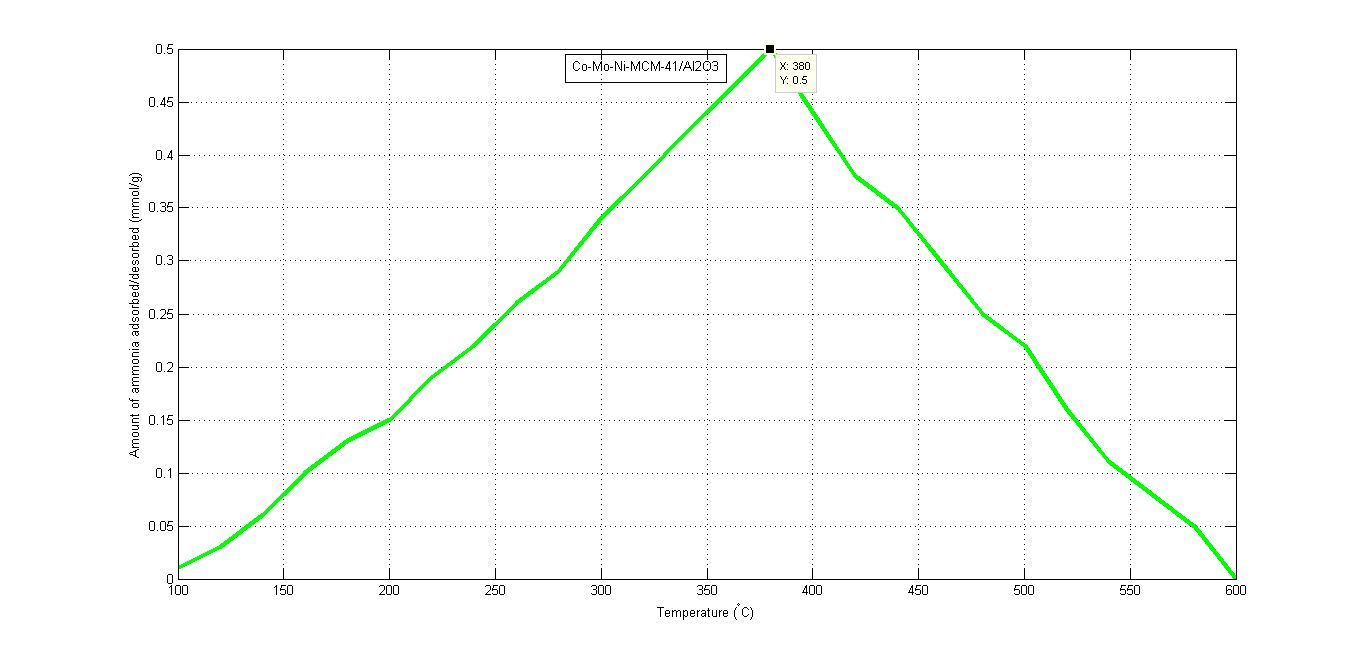
Figure 2. Acidity characteristics of the catalyst Co-Mo-Ni-MCM-41/Al2O3
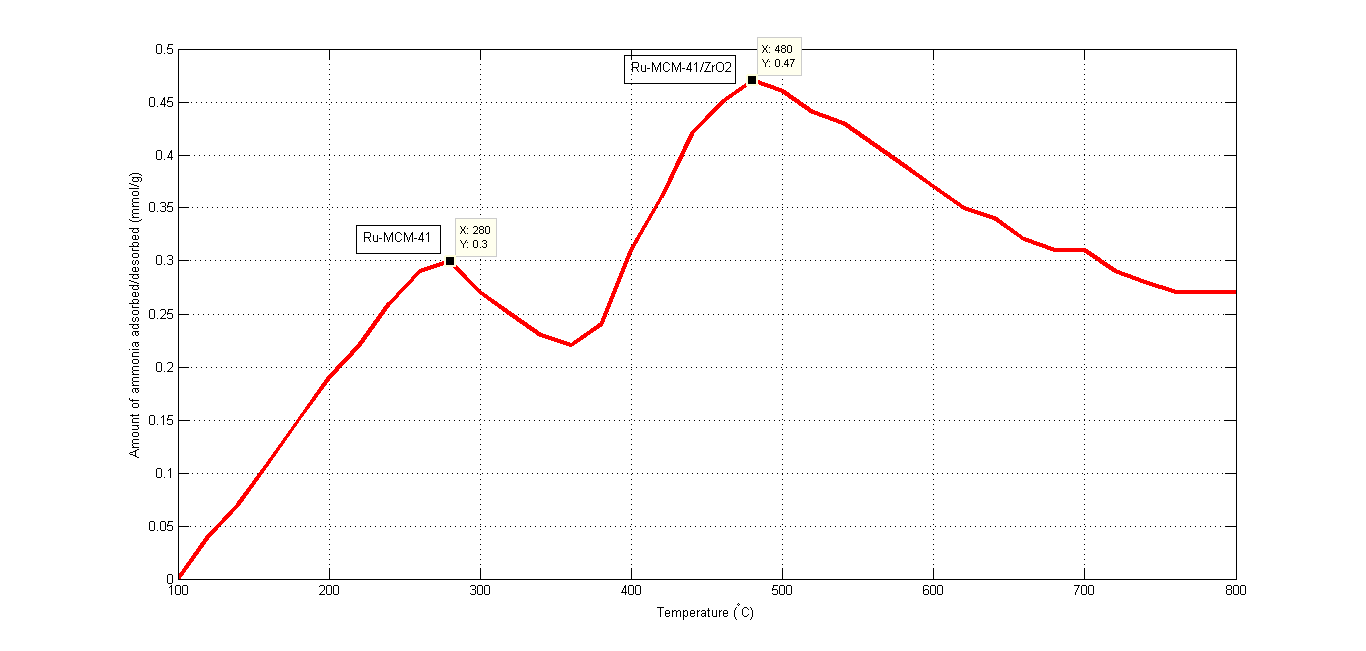
Figure 3. Acidity characteristics of the catalyst Ru-MCM-41/ZrO2
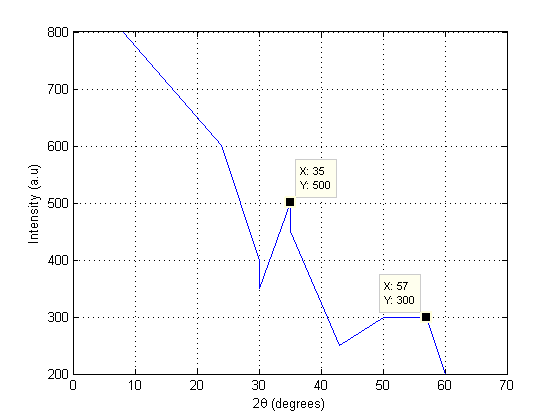
Figure 4. XRD analysis for the catalyst ZrO2/ZSM-5/Fe3O4
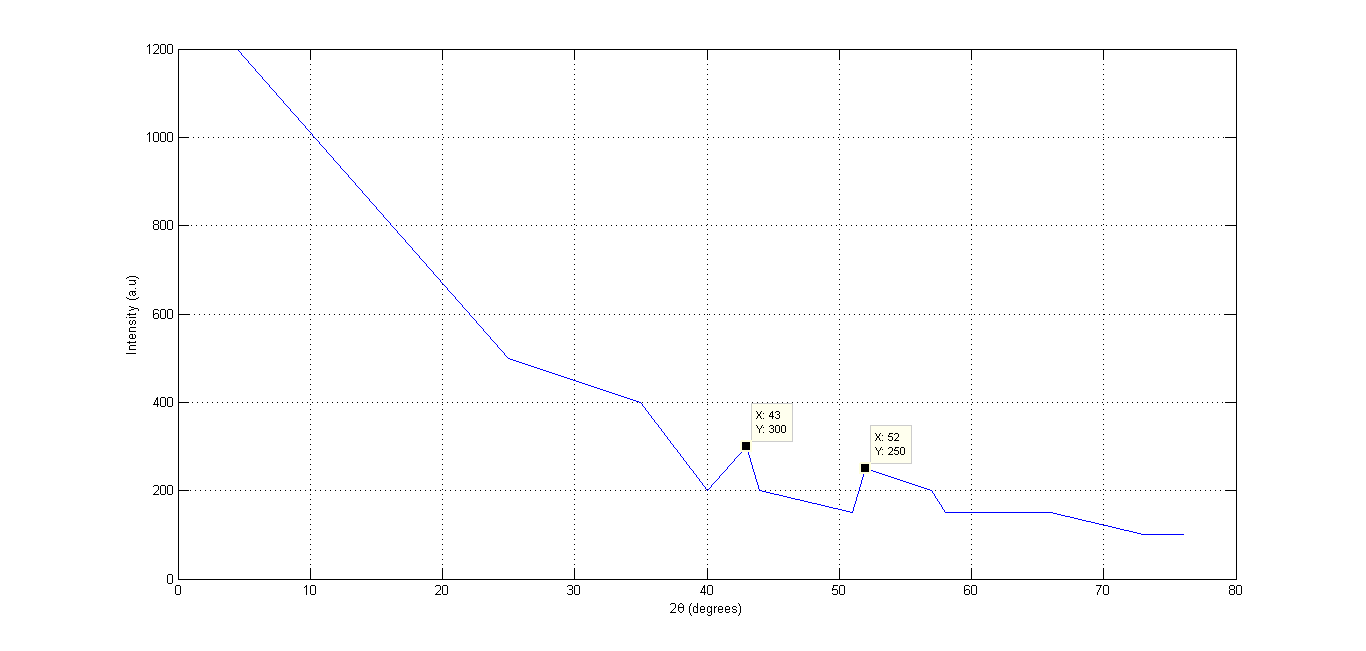
Figure 5. XRD analysis for the catalyst Co-Mo-Ni-MCM-41/Al2O3
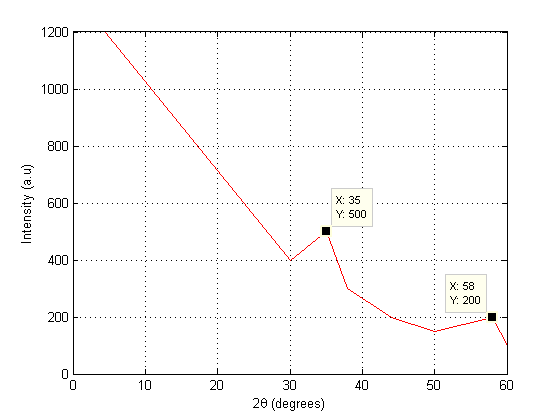
Figure 6. XRD analysis for the catalyst Ru-MCM-41/ZrO2
Table 1. Nitrogen adsorption–desorption isotherms at 77 K to determine BET surface area and BJH pore size distribution for the catalyst ZrO₂/ZSM-5/Fe₃O4.
|
P/P0 |
V (m3/kg) |
(kg/m3) |
r (nm) |
∆V (m3/kg) |
∆r(nm) |
∆V/∆r (m3/kg.nm) |
|
0.05 |
16.4*10-3 |
3.21 |
0.320 |
– |
– |
– |
|
0.10 |
32.8*10-3 |
3.39 |
0.417 |
16.4*10-3 |
0.097 |
169.07*10-3 |
|
0.15 |
49.2*10-3 |
3.58 |
0.506 |
16.4*10-3 |
0.089 |
184.27*10-3 |
|
0.20 |
65.6*10-3 |
3.81 |
0.569 |
16.4*10-3 |
0.090 |
182.22*10-3 |
|
0.25 |
82.0*10-3 |
4.06 |
0.692 |
16.4*10-3 |
0.096 |
170.83*10-3 |
|
0.30 |
98.4*10-3 |
4.36 |
0.797 |
16.4*10-3 |
0.105 |
156.19*10-3 |
|
0.40 |
131.2*10-3 |
5.08 |
1.046 |
32.8*10-3 |
0.250 |
131.2*10-3 |
|
0.50 |
164*10-3 |
6.10 |
1.384 |
32.8*10-3 |
0.337 |
97.33*10-3 |
|
0.60 |
196*10-3 |
7.61 |
1.878 |
32.8*10-3 |
0.494 |
66.40*10-3 |
|
0.70 |
229*10-3 |
10.18 |
2.690 |
32.8*10-3 |
0.812 |
40.39*10-3 |
|
0.80 |
262.4*10-3 |
15.24 |
4.299 |
32.8*10-3 |
1.609 |
20.39*10-3 |
|
0.90 |
295.2*10-3 |
30.80 |
9.105 |
32.8 |
4.806 |
6.82*10-3 |
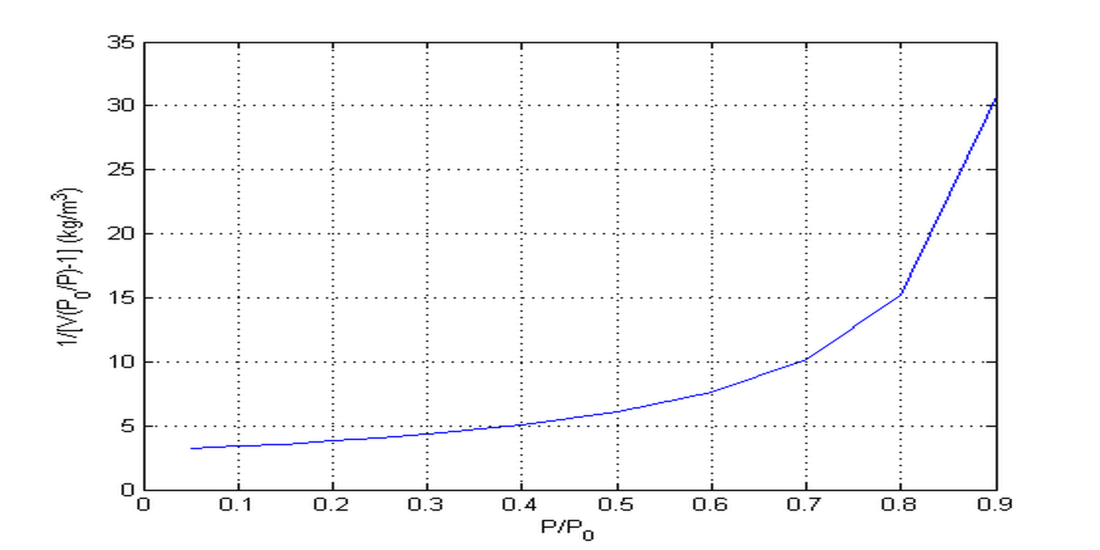
Figure 7. Nitrogen adsorption–desorption isotherms at 77 K to determine BET surface area for the catalyst ZrO₂/ZSM-5/Fe₃O.
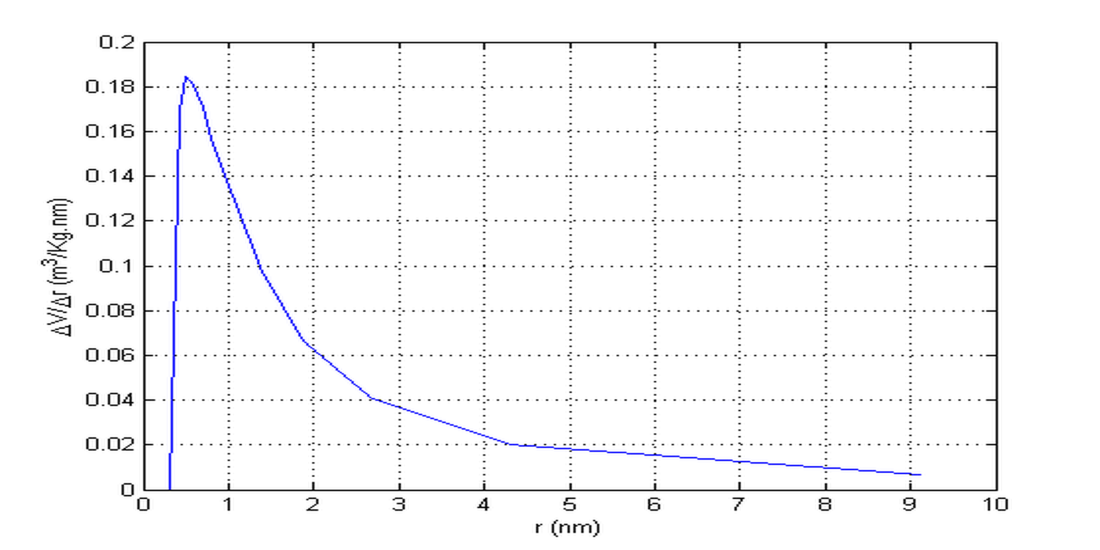
Figure 8. Nitrogen adsorption–desorption isotherms at 77 K to determine BJH pore size distribution for the catalyst ZrO₂/ZSM-5/Fe₃O.
Table 2. Nitrogen adsorption–desorption isotherms at 77 K to determine BET surface area and BJH pore size distribution for the catalyst Co–Mo–Ni–MCM-41/Al₂O₃.
|
P/P0 |
V (m3/g) |
(kg/m3) |
r (nm) |
∆V (m3/g) |
∆r (nm) |
∆V/∆r (m3/kg.nm) |
|
0.05 |
10.2*10-3 |
5.16 |
0.320 |
– |
– |
– |
|
0.10 |
20.5*10-3 |
5.42 |
0.417 |
10.3*10-3 |
0.097 |
106.19*10-3 |
|
0.15 |
30.8*10-3 |
5.73 |
0.506 |
10.3*10-3 |
0.089 |
115.73*10-3 |
|
0.20 |
41.1*10-3 |
6.08 |
0.569 |
10.3*10-3 |
0.090 |
114.44*10-3 |
|
0.25 |
51.4*10-3 |
6.49 |
0.692 |
10.3*10-3 |
0.096 |
107.29*10-3 |
|
0.30 |
61.7*10-3 |
6.96 |
0.797 |
10.3*10-3 |
0.105 |
98.10*10-3 |
|
0.40 |
82.1*10-3 |
8.12 |
1.046 |
20.6*10-3 |
0.250 |
82.40*10-3 |
|
0.50 |
102.5*10-3 |
9.76 |
1.384 |
20.6*10-3 |
0.337 |
61.13*10-3 |
|
0.60 |
122.9*10-3 |
12.14 |
1.878 |
20.6*10-3 |
0.494 |
41.70*10-3 |
|
0.70 |
143.3*10-3 |
16.27 |
2.690 |
20.6*10-3 |
0.812 |
25.37*10-3 |
|
0.80 |
163.7*10-3 |
24.43 |
4.299 |
20.6*10-3 |
1.609 |
12.80*10-3 |
|
0.90 |
184.1*10-3 |
49.38 |
9.105 |
20.6*10-3 |
4.806 |
4.29*10-3 |
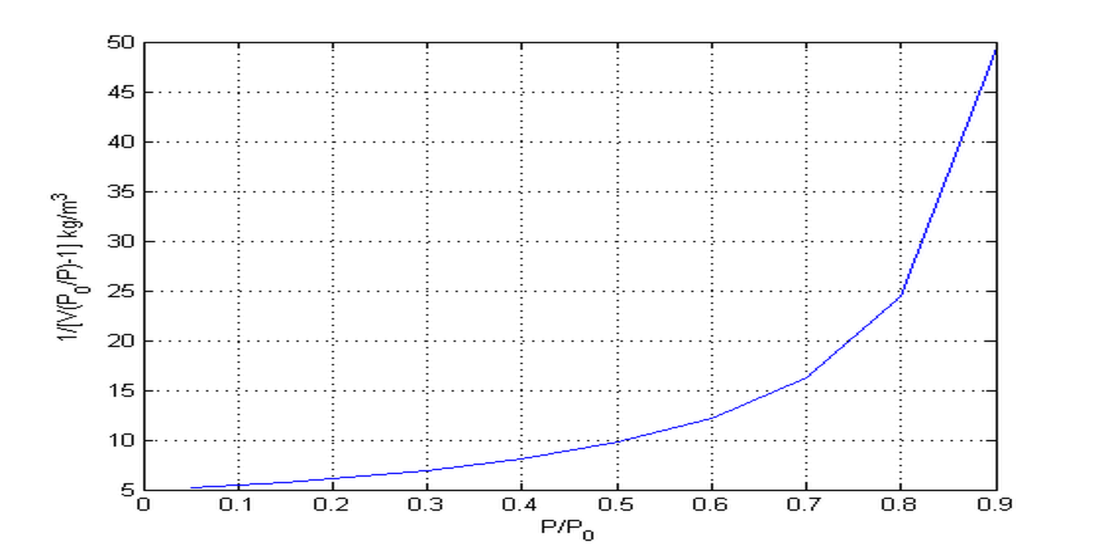
Figure 9. Nitrogen adsorption–desorption isotherms at 77 K to determine BET surface area for the catalyst Co–Mo–Ni–MCM-41/Al₂O₃.
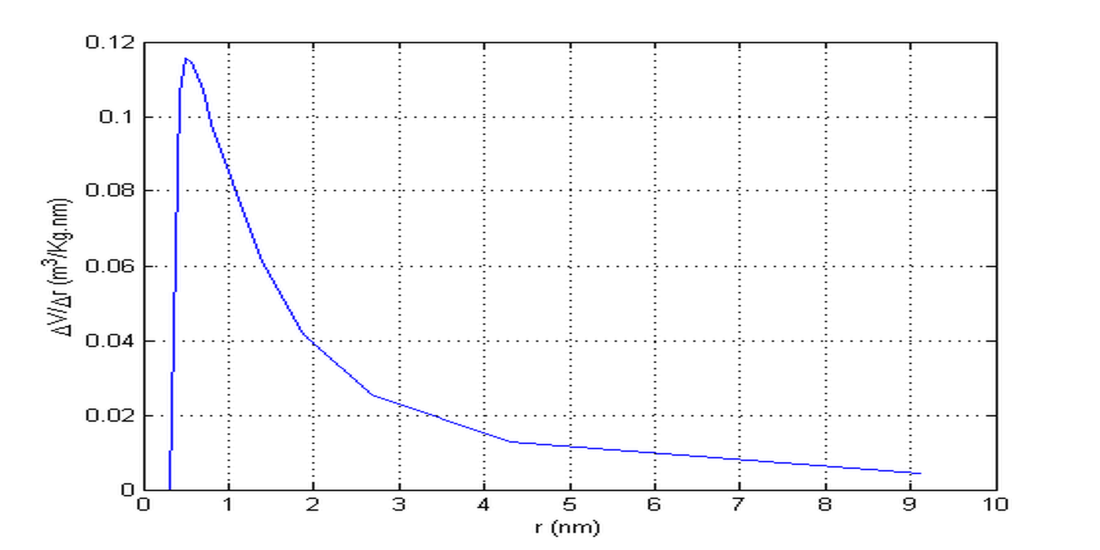
Figure 10. Nitrogen adsorption–desorption isotherms at 77 K to determine BJH pore size distribution for the catalyst Co–Mo–Ni–MCM-41/Al₂O₃.
Table 3. Nitrogen adsorption–desorption isotherms at 77 K to determine BET surface area and BJH pore size distribution for the catalyst Ru–MCM-41/ZrO₂.
|
P/P0 |
V (m3/kg) |
(kg/m3) |
r (nm) |
∆V (m3/kg) |
∆r (nm) |
∆V/∆r (m3/kg.nm) |
|
0.05 |
12.3*10-3 |
4.28 |
0.320 |
– |
– |
– |
|
0.10 |
24.6*10-3 |
4.52 |
0.417 |
12.3*10-3 |
0.097 |
126.80*10-3 |
|
0.15 |
36.9*10-3 |
4.78 |
0.506 |
12.3*10-3 |
0.089 |
138.20*10-3 |
|
0.20 |
49.2*10-3 |
5.08 |
0.569 |
12.3*10-3 |
0.090 |
136.67*10-3 |
|
0.25 |
61.5*10-3 |
5.42 |
0.692 |
12.3*10-3 |
0.096 |
128.13*10-3 |
|
0.30 |
73.8*10-3 |
5.81 |
0.797 |
12.3*10-3 |
0.105 |
117.14*10-3 |
|
0.40 |
98.4*10-3 |
6.78 |
1.046 |
24.6*10-3 |
0.250 |
49.20*10-3 |
|
0.50 |
123*10-3 |
8.13 |
1.384 |
24.6*10-3 |
0.337 |
36.50*10-3 |
|
0.60 |
147.6*10-3 |
10.11 |
1.878 |
24.6*10-3 |
0.494 |
24.90*10-3 |
|
0.70 |
172.2*10-3 |
13.54 |
2.690 |
24.6*10-3 |
0.812 |
15.15*10-3 |
|
0.80 |
196.8*10-3 |
20.33 |
4.299 |
24.6*10-3 |
1.609 |
7.64*10-3 |
|
0.90 |
221.4*10-3 |
41.06 |
9.105 |
24.6*10-3 |
4.806 |
2.56*10-3 |
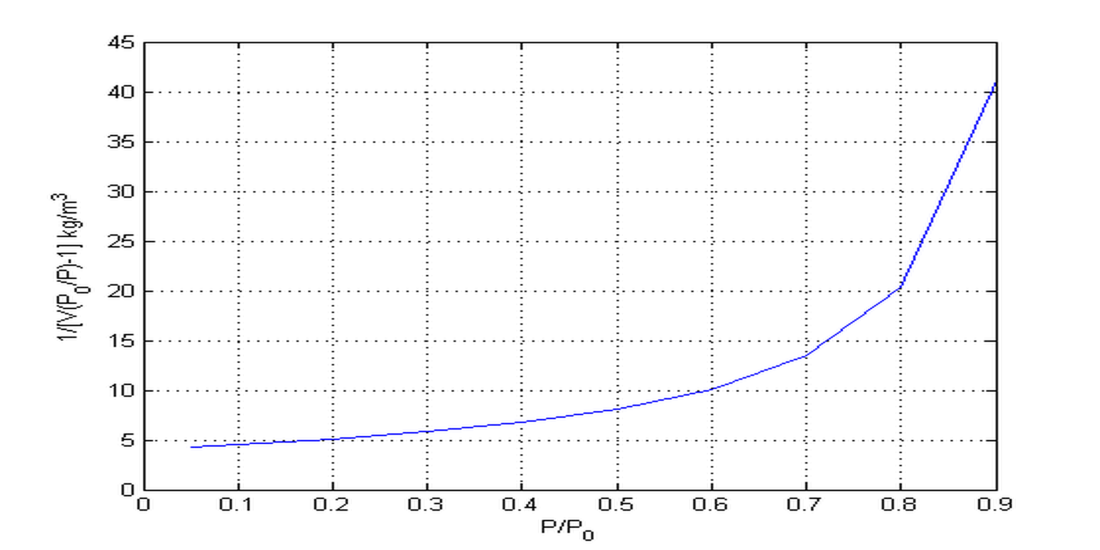
Figure 11. Nitrogen adsorption–desorption isotherms at 77 K to determine BET surface area for the catalyst Ru–MCM-41/ZrO₂.
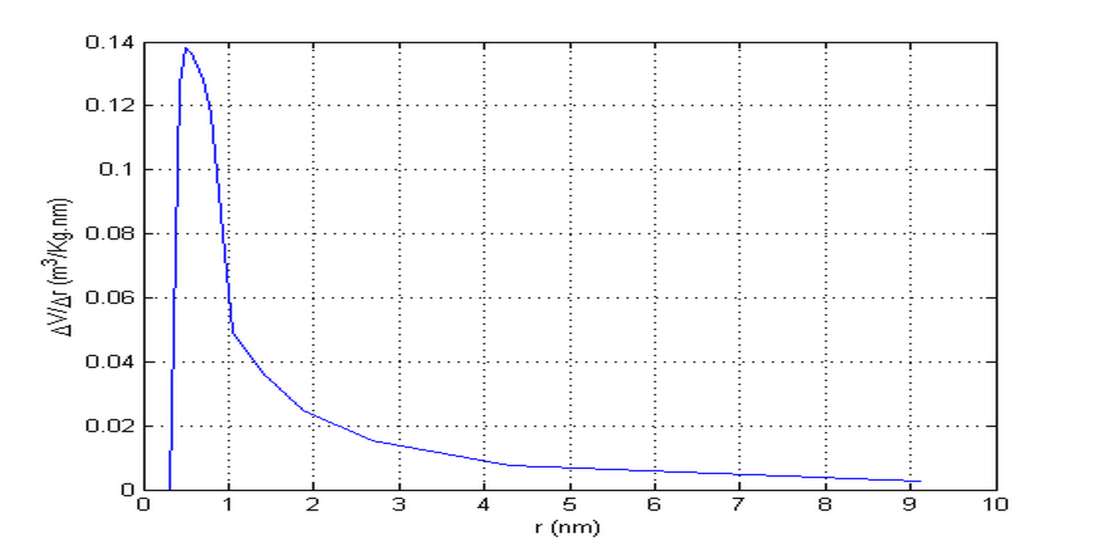
Figure 12. Nitrogen adsorption–desorption isotherms at 77 K to determine BJH pore size distribution for the catalyst Ru–MCM-41/ZrO₂.
3.3 Product Distribution and Fuel Selectivity
Distinct selectivity patterns were observed depending on catalyst type. Ru–MCM-41/ZrO₂ favored C₈–C₁₆ hydrocarbons corresponding to jet fuel, attributed to moderate acidity that yields high selectivity of 68%. ZrO₂/ZSM-5/Fe₃O₄ produced higher proportions of C₅–C₁₂ gasoline-range hydrocarbons with a high selectivity of 72% due to enhanced β-scission and isomerization within acidic micropores. Co–Mo–Ni–MCM-41/Al₂O₃ promoted C₁₂–C₂₀ diesel-range products, consistent with controlled cracking and hydrogen transfer reactions with a high selectivity of 70%.
3.4 Structure–Performance Relationship
The observed selectivity trends highlight the critical role of catalyst architecture. Mesoporosity facilitates polymer diffusion, while acidity and metal functionality determine chain scission pathways. By balancing these parameters, intrinsic control over fuel-range distribution is achieved without post-separation upgrading.
3.5 Fuel Quality Assessment
The produced fuels exhibited physicochemical properties comparable to refinery-derived gasoline, diesel, and jet fuels. Octane and cetane numbers, flash points, and freezing points fell within acceptable ranges as in tables 15 to 23, confirming practical applicability.
The reported fuel properties are presented for comparative assessment with refinery benchmarks, and minor deviations fall within acceptable experimental uncertainty ranges.
Table.4 Comparison with published studies
|
Catalyst |
Main product |
Selectivity % |
Reference |
|
|
ZrO₂/ZSM-5/Fe₃O₄ |
Gasoline |
70 |
This study |
|
|
Ru–MCM-41/ZrO₂ |
Jet fuel |
72 |
This study |
|
|
Co–Mo–Ni–MCM-41/Al₂O₃ |
Diesel |
70 |
This study |
|
|
HZSM-5 |
Gasoline |
50 – 60 |
[Smith et al., 2020] |
|
|
Pt/Al2O3 |
Diesel |
40 – 50 |
[Johnson et al., 2019] |
|
Table 5. Mass Balance of HDPE Catalytic Pyrolysis using ZrO2/ZSM-5/Fe3O4
|
Feed (kg) |
Liquid (%) |
Gas (%) |
Solid (%) |
|
1 |
72 |
0.251 |
0.029 |
Table 6. Mass Balance of LLDPE Catalytic Pyrolysis using ZrO2/ZSM-5/Fe3O4
|
Feed (kg) |
Liquid (%) |
Gas (%) |
Solid (%) |
|
1 |
70 |
27 |
3 |
Table 7. Mass Balance of LDPE Catalytic Pyrolysis using ZrO2/ZSM-5/Fe3O4
|
Feed (kg) |
Liquid (%) |
Gas (%) |
Solid (%) |
|
1 |
71 |
24 |
5 |
Table 8. Mass Balance of HDPE Catalytic Pyrolysis using Co-Mo-Ni-MCM-41/Al2O3
|
Feed (kg) |
Liquid (%) |
Gas (%) |
Solid (%) |
|
1 |
70 |
27.4 |
2.6 |
Table 9. Mass Balance of LLPE Catalytic Pyrolysis using Co-Mo-Ni-MCM-41/Al2O3
|
Feed (kg) |
Liquid (%) |
Gas (%) |
Solid (%) |
|
1 |
70 |
26 |
4 |
Table 10. Mass Balance of LDPE Catalytic Pyrolysis using Co-Mo-Ni-MCM-41/Al2O3
|
Feed (kg) |
Liquid (%) |
Gas (%) |
Solid (%) |
|
1 |
70 |
25 |
5 |
Table 12. Mass Balance of HDPE Catalytic Pyrolysis using Ru-MCM-41/ZrO2
|
Feed (kg) |
Liquid (%) |
Gas (%) |
Solid (%) |
|
1 |
70 |
27.1 |
2.9 |
Table 13. Mass Balance of LLDPE Catalytic Pyrolysis using Ru-MCM-41/ZrO2
|
Feed (kg) |
Liquid (%) |
Gas (%) |
Solid (%) |
|
1 |
68 |
28 |
4 |
Table 14. Mass Balance of LDPE Catalytic Pyrolysis using Ru-MCM-41/ZrO2
|
Feed (kg) |
Liquid (%) |
Gas (%) |
Solid (%) |
|
1 |
68 |
27 |
5 |
Table 15: Gasoline from LLDPE plastic waste vs Nile blend Khartoum refinery.
|
The physical property |
Gasoline from plastic waste (LLDPE) |
Gasoline from Khartoum refinery |
|
Distillation (initial boiling to final boiling point) (oC) |
34-193 |
33-193 |
|
Density (kg/m3) |
784 |
788.3 |
|
Octane number |
89 |
89-93 |
|
Total acid number (TAN), mg KOH/g |
0.01 |
0.01 |
|
Water content, ppm |
<0.01 |
< 0.01 |
|
Carbon residue, % mass |
0.05 |
0.05 |
|
Ash content, % mass |
0.05 |
< 0.03 |
|
Macro carbon, % mass |
0.03 |
< 0.02 |
|
Stability (0C) |
822-827 |
822 – 825 |
|
Vapor pressure kPa |
56 |
53 – 60 |
Table 16: Gasoline from LDPE plastic waste vs Nile blend of Khartoum refinery.
|
The physical property |
Gasoline from plastic waste (LDPE) |
Gasoline from Khartoum refinery |
|
Distillation (initial boiling to final boiling point) (oC) |
30-195 |
33-193 |
|
Density (kg/m3) |
787 |
788.3 |
|
Octane number |
91 |
89-93 |
|
Total acid number (TAN), mg KOH/g |
0.01 |
0.01 |
|
Water content, ppm |
<0.01 |
< 0.01 |
|
Carbon residue, % mass |
0.07 |
0.05 |
|
Ash content, % mass |
0.02 |
< 0.03 |
|
Macro carbon, % mass |
<0.02 |
< 0.02 |
|
Stability 0C |
820-825 |
822 – 825 |
|
Vapor pressure kPa |
56 |
53 – 60 |
Table 17: Gasoline from HDPE plastic waste vs Nile blend Khartoum refinery.
|
The physical property |
Gasoline from plastic waste (HDPE) |
Gasoline from Khartoum refinery |
|
Distillation (initial boiling to final boiling point) (oC) |
30-195 |
33-193 |
|
Density (kg/m3) |
790 |
788.3 |
|
Octane number |
88 |
89-93 |
|
Total Acid Number (TAN), mg KOH/g |
0.01 |
0.01 |
|
Water content, ppm |
<0.01 |
< 0.01 |
|
Carbon residue, %mass |
0.08 |
0.05 |
|
Ash content, % mass |
0.07 |
< 0.03 |
|
Macro carbon % mass |
0.04 |
< 0.02 |
|
Stability (0C) |
821-826 |
822 – 825 |
|
Vapor pressure kPa |
56 |
53 – 60 |
Table 18: Diesel from LLDPE plastic waste vs Nile blend of Khartoum refinery.
|
The physical property |
Diesel from plastic waste (LLDPE) |
Diesel from Khartoum refinery |
|
Boiling point (oC) |
240 – 350 |
288 – 380 |
|
Density (kg/m3) |
814 |
827 – 835 |
|
Flash point (oC) |
76.5 |
70 – 85 |
|
Kinematic viscosity (mm2/s) at 38o C |
3.4 |
3.7 – 4 |
|
Total Acid Number (TAN) mg KOH/g |
0.1 |
0.1 |
|
Cloud point (oC) |
8 |
5 – 12 |
|
Water content, ppm |
0.01 |
< 0.02 |
|
Mercaptan, % mass |
– |
0.06 |
|
Carbon residue % mass |
0.2 |
0.05 |
|
Ash content % mass |
0.01 |
0.01 or 0.02 |
|
Sulfur content % mass |
– |
0.05 |
|
Cetane Number |
47 |
>45 |
Table 19: Diesel from LDPE plastic waste vs Nile blend Khartoum refinery.
|
The physical property |
Diesel from plastic waste (LDPE) |
Diesel from Khartoum refinery |
|
Distillation (initial boiling point to final boiling point) (oC) |
250 – 360 |
288 – 388 |
|
Density (kg/m3) |
833 |
827 – 835 |
|
Flash point (oC) |
76.5 |
70 – 85 |
|
Kinematic viscosity (mm2/s) at (38oC) |
3.5 |
3.7 – 4 |
|
Total Acid Number (TAN) mg KOH/g |
0.1 |
0.1 |
|
Cloud point ( oC) |
11 |
5 – 12 |
|
Water content ppm |
0.01 |
< 0.02 |
|
Mercaptan, %mass |
– |
0.06 |
|
Carbon residue % mass |
0.2 |
0.05 |
|
Ash content % mass |
0.01 |
0.01 or0.02 |
|
Sulfur content % mass |
– |
0.05 |
|
Cetane Number |
46 |
>45 |
Table 20: Diesel from HDPE plastic waste vs Nile blend of Khartoum refinery.
|
The physical property |
Diesel from plastic waste (HDPE) |
Diesel from Khartoum refinery |
|
Boiling point (oC) |
282 – 363 |
288 – 380 |
|
Density (kg/m3) |
836 |
827 – 835 |
|
Flash point (oC) |
75 |
70 – 85 |
|
Kinematic viscosity (mm2/s) at 38 (oC) |
3.7 |
3.7 – 4 |
|
Total Acid Number (TAN) mg KOH/g |
0.1 |
0.1 |
|
Cloud point ( oC) |
12 |
5 – 12 |
|
Water content ,ppm |
– |
< 0.02 |
|
Mercaptan, % mass |
– |
0.06 |
|
Carbon residue % mass |
0.2 |
0.05 |
|
Ash content % mass |
0.01 |
0.01 or 0.02 |
|
Sulfur content % mass |
– |
0.05 |
|
Cetane Number |
42 |
>45 |
Table 21: JET from LLDPE plastic waste vs Nile blend Khartoum refinery.
|
The physical property |
Jet from plastic waste (LLDPE) |
Jet from Khartoum refinery |
|
Boiling point (oC) |
150 – 258 |
170 – 270 |
|
Density (kg/m3) |
722 |
723 – 725 |
|
Flash point (oC) |
56 |
55 – 57 |
|
Kinematic viscosity mm2/s at 38 oC |
5 |
5 or 6 |
|
Acidity mgKOH/g |
0.01 |
0.01 |
|
Freezing point ( oC) |
-57 |
-55 or -56 |
|
Conductivity |
164 |
157 – 240 |
|
Colour |
+30 |
+30 – +33 |
|
Aniline point ( oC) |
55 |
55 – 60 |
|
Gum content % mass |
0.57 |
0.55 – 0.57 |
|
Sulfur content % mass |
– |
0.06 |
Table 22: JET from LDPE plastic waste vs Nile blend Khartoum refinery.
|
The physical property |
Jet from plastic waste (LDPE) |
Jet from Khartoum refinery |
|
Boiling point |
160 – 260 |
170 – 270 |
|
Density (kg/m3) |
723 |
723 – 725 |
|
Flash point (oC) |
56 |
55 – 57 |
|
Kinematic viscosity (mm2/s) at (38 oC) |
5 |
5 or 6 |
|
Acidity mg KOH/g |
0.01 |
0.01 |
|
Freezing point ( oC) |
-56 |
-55 or -56 |
|
Conductivity S/m |
164 |
157 – 240 |
|
Color |
+31 |
+30 – +33 |
|
Aniline point (oC) |
57 |
55 – 60 |
|
Gum content % mass |
0.58 |
0.55 – 0.57 |
|
Sulfur content % mass |
– |
0.06 |
Table 23: JET HDPE plastic waste vs Nile blend of Khartoum refinery.
|
The physical property |
Jet from plastic waste (HDPE) |
Jet from Khartoum refinery |
|
Boiling point (oC) |
160 – 264 |
170 – 270 |
|
Density kg/m3 |
731 |
725 – 732 |
|
Flash point (oC) |
57 |
55 – 57 |
|
Kinematic viscosity mm2/s at 38 oC |
5 |
5 or 6 |
|
Acidity mg KOH/g |
0.01 |
0.01 |
|
Freezing point (oC) |
-57 |
-55 or -56 |
|
Conductivity S/m |
164 |
157 – 240 |
|
Color |
+34 |
+30 – +33 |
|
Aniline point (oC) |
59 |
55 – 60 |
|
Gum content % mass |
0.60 |
0.55 – 0.57 |
|
Sulfur content % mass |
– |
0.06 |
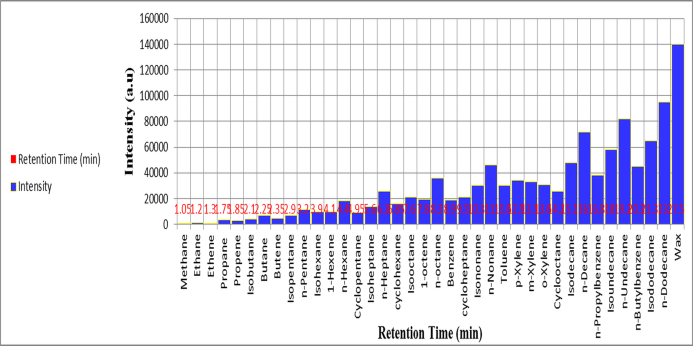
Figure 13. Representative Chromatogram (plotted using Excel) of HDPE Gasoline-Derived hydrocarbons
\
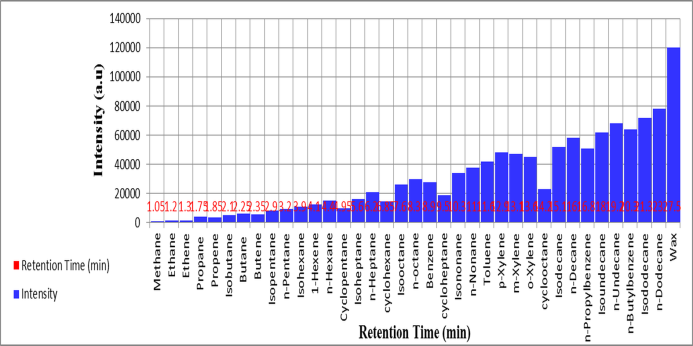
Figure 14. Representative Chromatogram (plotted using Excel) of LDPE Gasoline-Derived hydrocarbons
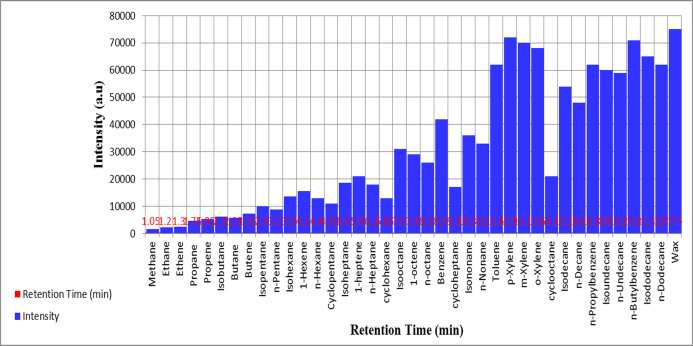
Figure 15. Representative Chromatogram (plotted using Excel) of LLDPE Gasoline-Derived hydrocarbons
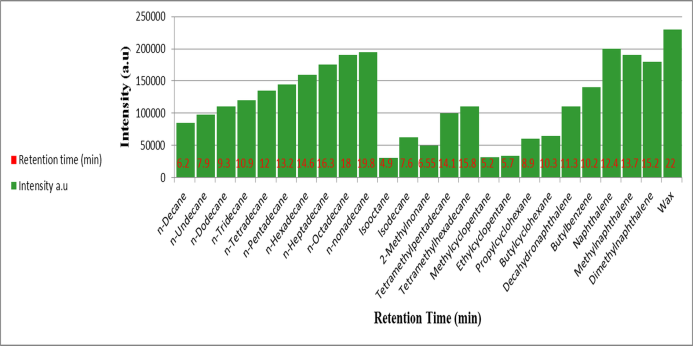
Figure 16. Representative Chromatogram (plotted using Excel)of HDPE Diesel-Derived hydrocarbons
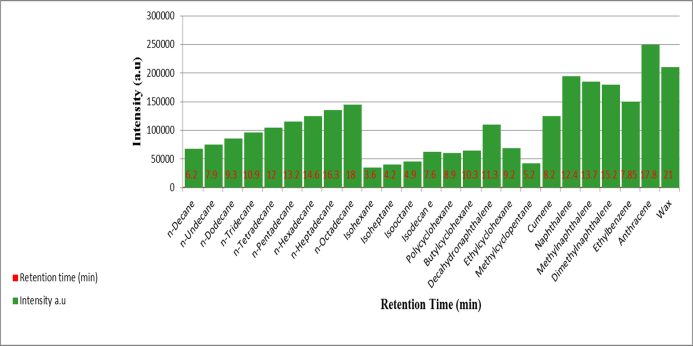
Figure 17. Representative Chromatogram (plotted using Excel) of LLDPE Diesel-Derived hydrocarbons
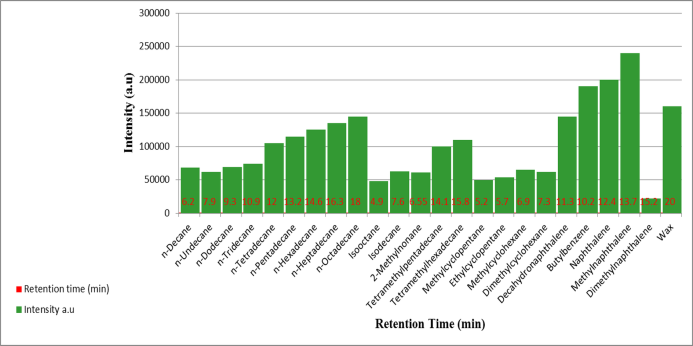
Figure 18. Representative Chromatogram (plotted using Excel) of LDPE Diesel-Derived hydrocarbons
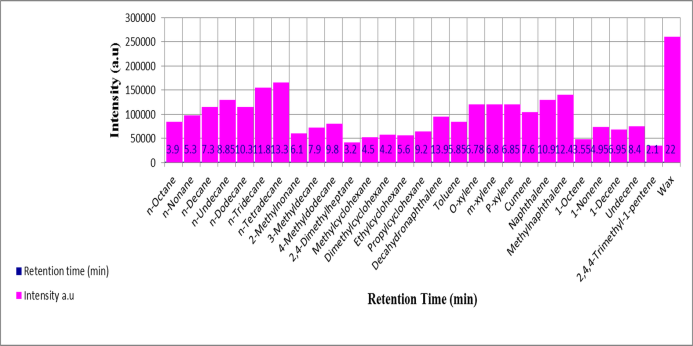
Figure 19. Representative Chromatogram (plotted using Excel) of HDPE Jet-Derived hydrocarbons
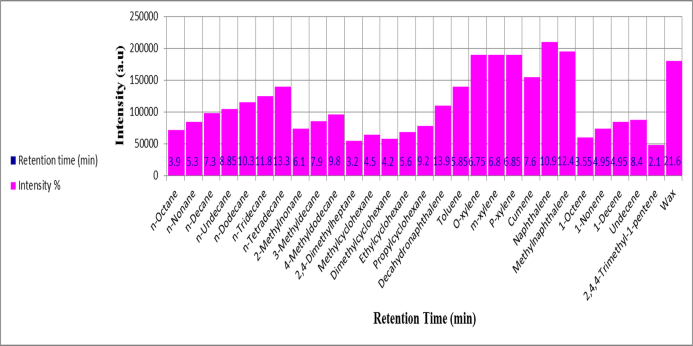
Figure 20. Representative Chromatogram (plotted using Excel) of LLDPE Jet-Derived hydrocarbons
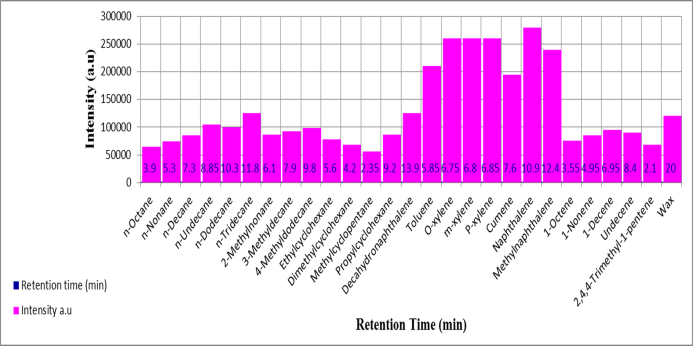
Figure 21. Representative Chromatogram (plotted using Excel) of LDPE Jet-Derived hydrocarbons
3.6 Measurements uncertainties:
1.Surfac area: BET method (±5% m2/g).
2. Pore size: BJH method (±0.5 m).
3. Acidity: NH3-TPD (±0.1 mmol/g).
4. Product composition: GC-MS (±2%) for major compositions.
4. Conclusions
This work demonstrates that selective catalytic pyrolysis of polyethylene waste can be achieved through rational catalyst design. By tailoring pore structure, acidity, and metal functionality, fuel-range selectivity is intrinsically controlled. This study highlights the potential of catalyst-driven selectivity in polyethylene pyrolysis through rational catalyst formulation. While comprehensive physiochemical characterization is required for full structure-activity correlation, the present results provide a strong proof of concept for targeted fuel-range production from plastic waste.
Acknowledgements
The authors acknowledge the University of Science and Technology for supporting this research.
Conflict of Interest
The authors declare no competing interests.
References
1. Al-Sabih, A. S.; Al-Sayed, F. Pyrolysis of LDPE, LLDPE, and HDPE: Kinetic Study. J. Anal. Appl. Pyrolysis 2023, 172, 105750. https://doi.org/10.1016/j.jaap.2023.105750.
2. Agamuthu, P.; Hashim, S. Waste Management: Concepts, Practices and Sustainability; CRC Press: Boca Raton, FL, 2022; pp 145–170, 215–240.
3. Kumar, A.; Singh, S. Advanced Catalytic Systems for Fuel Production; Springer: Singapore, 2022; pp 55–80, 105–130.
4. Li, M.; Wang, Y.; Li, X. Fuel Production from Plastic Waste; Elsevier: Amsterdam, 2022.
5. Saha, B.; Vedachalam, S.; Agarwal, M.; Dalai, A. K.; Saxena, S.; Dally, B.; Roberts, W. L. Review on Production of Liquid Fuel from Plastic Wastes through Thermal and Catalytic Degradation. J. Energy Inst. 2024, 114, 101661. https://doi.org/10.1016/j.joei.2024.101661.
6. Scheirs, J.; Kaminsky, W. Plastic Recycling: Technologies; Wiley: Chichester, U.K., 2022.
7. Yansaneh, O. Y.; Zein, S. H. Latest Advances in Waste Plastic Pyrolytic Catalysis. Processes 2022, 10 (4), 683. https://doi.org/10.3390/pr10040683.
8. Singh, R.; Kumar, A. Sustainable Fuel Alternatives: Production, Applications and Challenges; CRC Press: Boca Raton, FL, 2022; pp 55–80, 125–150.
9. Zhang, J.; Wang, M. Catalytic Pyrolysis of Biomass and Plastics; Elsevier: Amsterdam, 2022; pp 125–150, 175–210.
10. Belrhazi, I.; Sair, S.; Ait Ousaleh, H.; Abdellaoui, Y.; Zahouily, M. Catalytic Transformation of Plastic Waste: Harnessing Zeolite for Enhanced Energy Product Yield in Pyrolysis. Energy Convers. Manag. 2024, 318, 118897. https://doi.org/10.1016/j.enconman.2024.118897.
11. González, Y. S.; Costa, C.; Márquez, M. C.; Ramos, P. Thermal and Catalytic Degradation of Polyethylene Wastes in the Presence of Silica Gel, 5A Molecular Sieve, and Activated Carbon. J. Hazard. Mater. 2011, 187, 101–112. https://doi.org/10.1016/j.jhazmat.2010.12.121.
12. Wang, M.; Zhang, Y.; Liu, Z.; et al. Preparation and Application of Zeolite Catalysts for Plastic Waste Conversion. Microporous Mesoporous Mater. 2023, 350, 112–125.
13. Fu, L.; Xiong, Q.; Wang, Q.; Cai, L.; Chen, Z.; Zhou, Y. Catalytic Pyrolysis of Waste Polyethylene Using Combined CaO and Ga/ZSM-5 Catalysts for High Value-Added Aromatics Production. ACS Sustainable Chem. Eng. 2022, 10, 12345–12356. https://doi.org/10.1021/acssuschemeng.2c02881.
14. Abdpour, N.; Hosseini, S. A. Fuel Production from Waste Plastics over Copper/Zeolite Catalysts. Int. J. Eng. 2024, 37 (12), 2445–2451.
15. Ertl, G.; Knözinger, H.; Weitkamp, J. Preparation of Solid Catalysts; Wiley-VCH: Weinheim, Germany, 1999; pp 85–98. https://doi.org/10.1002/9783527619528.
16. Gregg, S. J.; Sing, K. S. W. Adsorption, Surface Area and Porosity; Academic Press: London, 1982; pp 41–100.
17. Ruthven, D. M. Adsorption and Surface Area: Fundamentals and Applications; Wiley: Hoboken, NJ, 2022.
18. Sing, K. S. W. The Use of Nitrogen Adsorption for the Characterization of Porous Materials. Colloids Surf., A 2001, 187–188, 3–9. https://doi.org/10.1016/S0927-7757(01)00612-4.
19. Wagner, J. R. Fuel: Analysis and Characterization; ASTM International: West Conshohocken, PA, 2006.
20. Vlassa, M.; Filip, M.; Beldean-Galena, S.; Thiebaut, D.; Vial, J.; Petean, I. Investigation of Liquid Oils Obtained by Thermo-Catalytic Degradation of Plastic Wastes in Energy Recovery. Molecules 2025, 30, 1959. https://doi.org/10.3390/molecules30091959.