
Spatial Analysis of Radon Gas in Tap Water in the Old City of Najaf
التحليل المكاني لغاز الرادون في مياه الصنابير في مدينة النجف القديمة
Ghanim Sahib Abd1
1 University of Kufa, Al-Najaf, Iraq
DOI: https://doi.org/10.53796/hnsj66/32
Arabic Scientific Research Identifier: https://arsri.org/10000/66/32
Volume (6) Issue (6). Pages: 475 - 483
Received at: 2025-05-07 | Accepted at: 2025-05-15 | Published at: 2025-06-01
Abstract: This study evaluates radon gas concentrations in tap water across four neighborhoods in the Old City of Najaf, Iraq—Al-Huwaish, Al-Amara, Al-Barak, and Al-Mashraq—using spatial analysis and the RAD7 detection system. Water samples were collected and analyzed to determine the presence of radon, a naturally occurring radioactive gas with potential health risks. The results showed that radon concentrations in all studied areas were below the maximum permissible limit of 11 Bq/L, as set by international standards such as the WHO and IAEA. The highest average value was recorded in Al-Barak (5.4 Bq/L), while other districts had significantly lower averages. Slight variations in concentration levels were attributed to geological differences and the depth of water sources. This spatial assessment highlights the overall safety of the water supply in the Old City and underscores the importance of continuous monitoring, especially in historical urban settings with aging infrastructure.
Keywords: Radon, Tap Water, GIS, Najaf, Radiation.
المستخلص: تهدف هذه الدراسة إلى تقييم تركيزات غاز الرادون في مياه الصنابير في أربعة أحياء من المدينة القديمة في النجف، العراق: الحويش، العمارة، البراق، والمشرق، باستخدام التحليل المكاني وجهاز الكشف RAD7. تم جمع عينات من المياه وتحليلها لتحديد وجود غاز الرادون، وهو غاز مشع طبيعي قد يشكل خطراً صحياً. أظهرت النتائج أن تركيزات الرادون في جميع المناطق المدروسة كانت دون الحد الأقصى المسموح به البالغ 11 بكريل/لتر، وفقاً للمعايير الدولية مثل منظمة الصحة العالمية والوكالة الدولية للطاقة الذرية. تم تسجيل أعلى متوسط في حي البراق (5.4 بكريل/لتر)، بينما كانت المعدلات في الأحياء الأخرى أقل بكثير. وعُزيت الاختلافات الطفيفة في التركيز إلى الفروقات الجيولوجية وعمق مصادر المياه. تؤكد هذه الدراسة على سلامة شبكة المياه في المدينة القديمة وتبرز أهمية الرصد المستمر، خاصة في المناطق الحضرية التاريخية ذات البنية التحتية القديمة.
الكلمات المفتاحية: الرادون، مياه الشرب، نظم المعلومات الجغرافية، النجف، الإشعاع.
1. Introduction
Radon is a naturally occurring radioactive gas that can be found in rocks, dirt and water. It is created when uranium and thorium decay. It has no color, odor, or taste, which means that it cannot be detected without specialized equipment [1]. Radon is commonly associated with poor indoor air quality, particularly in the basements and lower floors of buildings. But it can also dissolve in groundwater, which means that it can turn up in drinking water. Radon in water varies depending on the source, depth and geology of the well. Radon is a radioactive gas, but it’s naturally occurring. It is odorless, colorless and has no taste. It is produced by the decay of uranium, of which there are varying amounts in rocks and soil[2]. Radon gas is created when uranium decays. That gas can escape into the air and accumulate in confined spaces such as homes and buildings. Typically, radon is associated with poor indoor air quality, but it can also seep into drinking water, particularly in regions where high uranium containing rock formations are penetrated by water wells[3]. Gas containing radon that exists dissolved in water can enter the air in the home, for example when the water is used for cooking, bathing or laundry. This contributes to the overall cumulative radon exposure in the environment. There is abundant evidence that being exposed to radon is unhealthy. Radon particles and its decay products are the single biggest cause of lung cancer among people who don’t smoke. For smokers, the risk is far greater. While drinking water with radon is considered a less significant way of being exposed to it, it can still increase the risk, particularly in areas where the water supply has high levels of radon. Drinking water is frequently drawn from groundwater in much of the world, including Iraq. This water may have varying levels of radon. The reason why radon in drinking water is a concern is when the water is used in the house, radon escapes to the air and thereby raises the indoor radon air level[4-5]. The finding underscores the importance of monitoring and regulating radon levels in both water and indoor air to reduce health risks. People generally take a variety of approaches to handle exposure to radon. Options include testing recorded water sources for radon levels, making homes more airtight and treating water to reduce radon levels. Public health organizations are extremely important, because they provide information and resources that help people and groups learn about and respond to the threat of radon exposure. As radon may have adverse effects on the health, actions are needed to be taken for people living in areas that are known to have it present[6]. This may mean monitoring the air inside and the water people drink every day, especially if the water comes from private wells. Short of educating and informing people to the dangers of radon and what can be done to prevent it, it is unlikely that public health measures can succeed in reducing radon-related illness. This study aims to apply spatial analysis to know how the drinkable water supply network of the Old City in Al-Najaf is distributed, its joyfulness and extent of its operation. It relies on geographic information systems (GIS) and field data to search for trends in space, service gaps and areas where pollution or lack of supply might occur. The research will support urban planners, water planners, and policymakers in providing improved water services and ensuring everyone has equal access, particularly in places with historical and/or cultural significance [7-8].
2. Goals of the Study
To find out how good the water in the Old City’s taps is.Geographic Information Systems (GIS) are used to look at how water quality is distributed in space.Finding any places where there are deficiencies or contamination.Offering suggestions or ways to make the water quality better.
3.Study Area: Where and how big the Old City is.
The old city of Najaf is an important place for history and culture. It has four main neighborhoods, which are called al-Huwaish, al-Buraq, al-Amara, and al-Mashraq.The al-Huwaish District shares borders with the al-Amara District to the west and the al-Buraq District to the east. It stands out because of al-Huwaish Mountain, a rocky area that is one of the most famous sights in the area.Part of Najaf that is fairly new is the Al-Buraq District. It has important ancient sites like Jabal al-Nour and Jabal al-Jamalah. It used to have small workshops where unique candles were made.The Al-Amara District is thought to be one of the biggest old neighborhoods. It was called the graveyard of Sheikh Sahib al-Jawahir, and many teachers and their families lived there. Jabal Sharafshah, al-Ribat District, and Ribat are some other small areas.Al-Mashraq District: People sometimes call it “al-Mishrak.” The neighborhood used to be called “Scholars’ Neighborhood” because there were so many students and scholars living there.
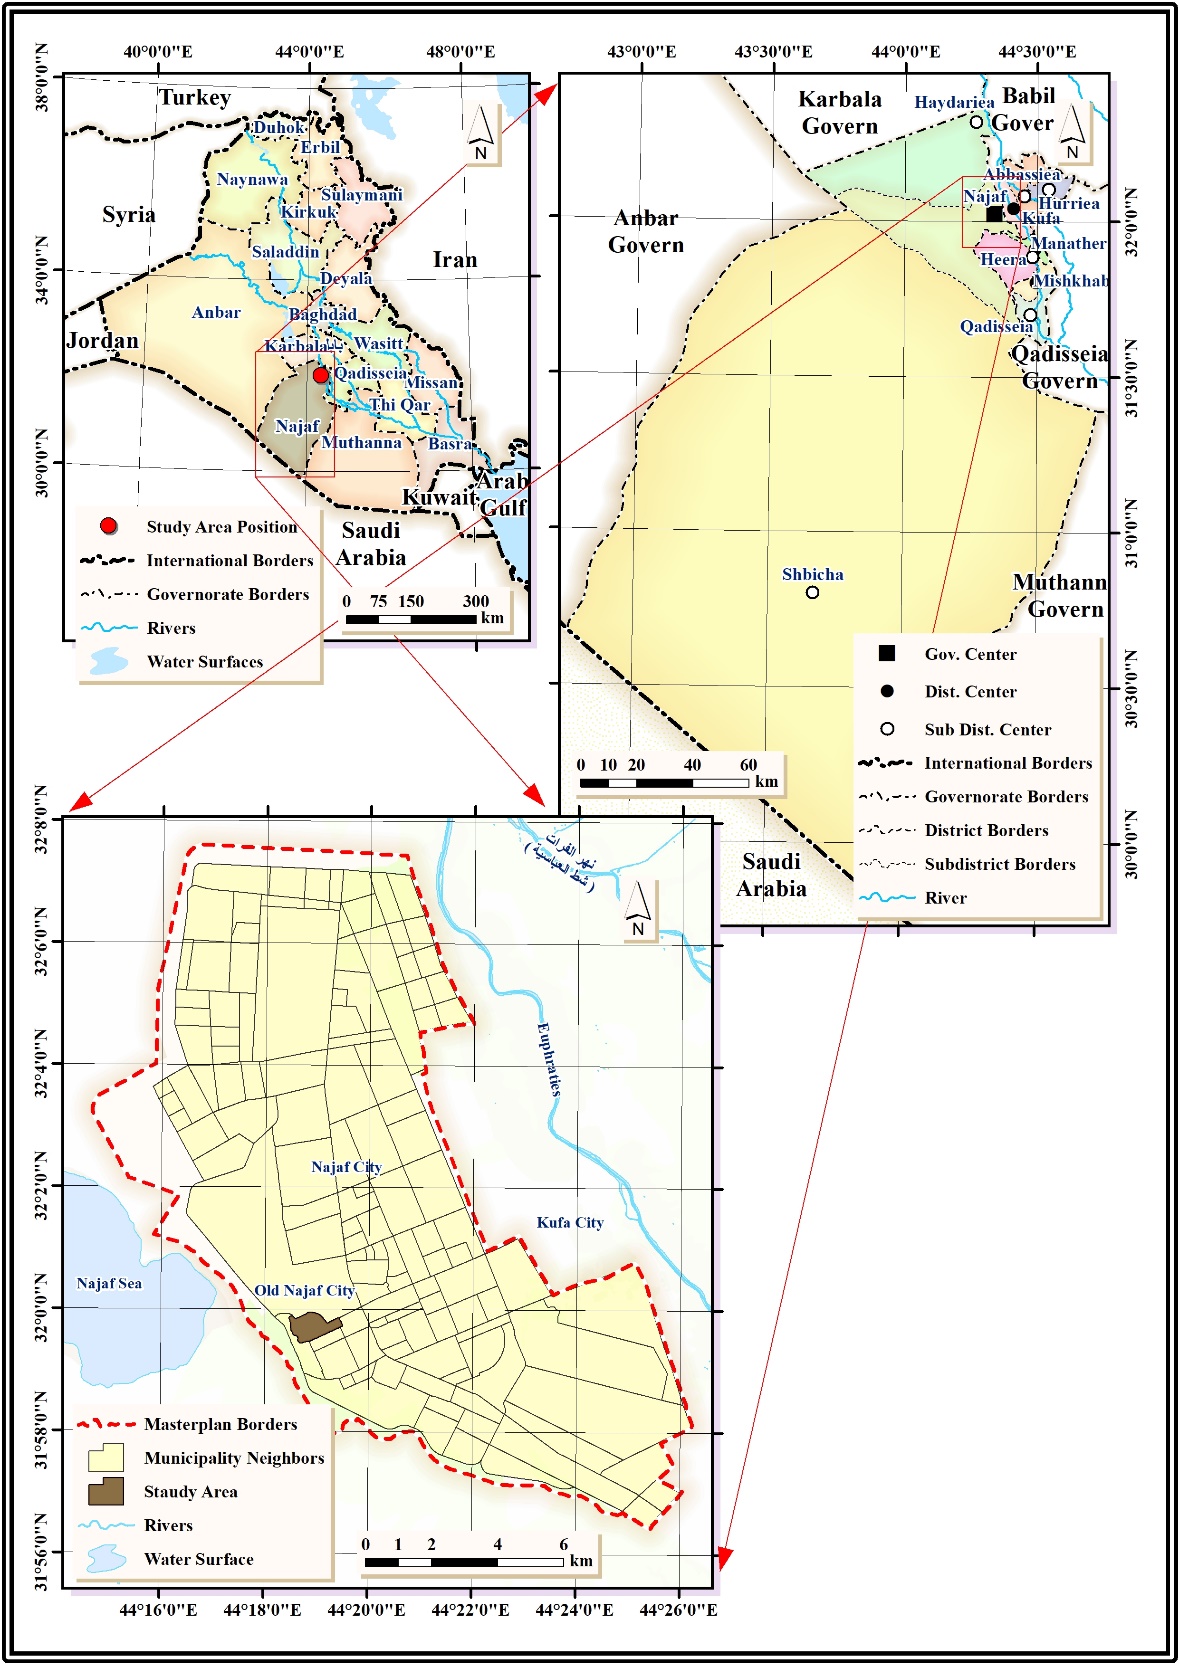
Figure 1: Map of the old city of Najaf
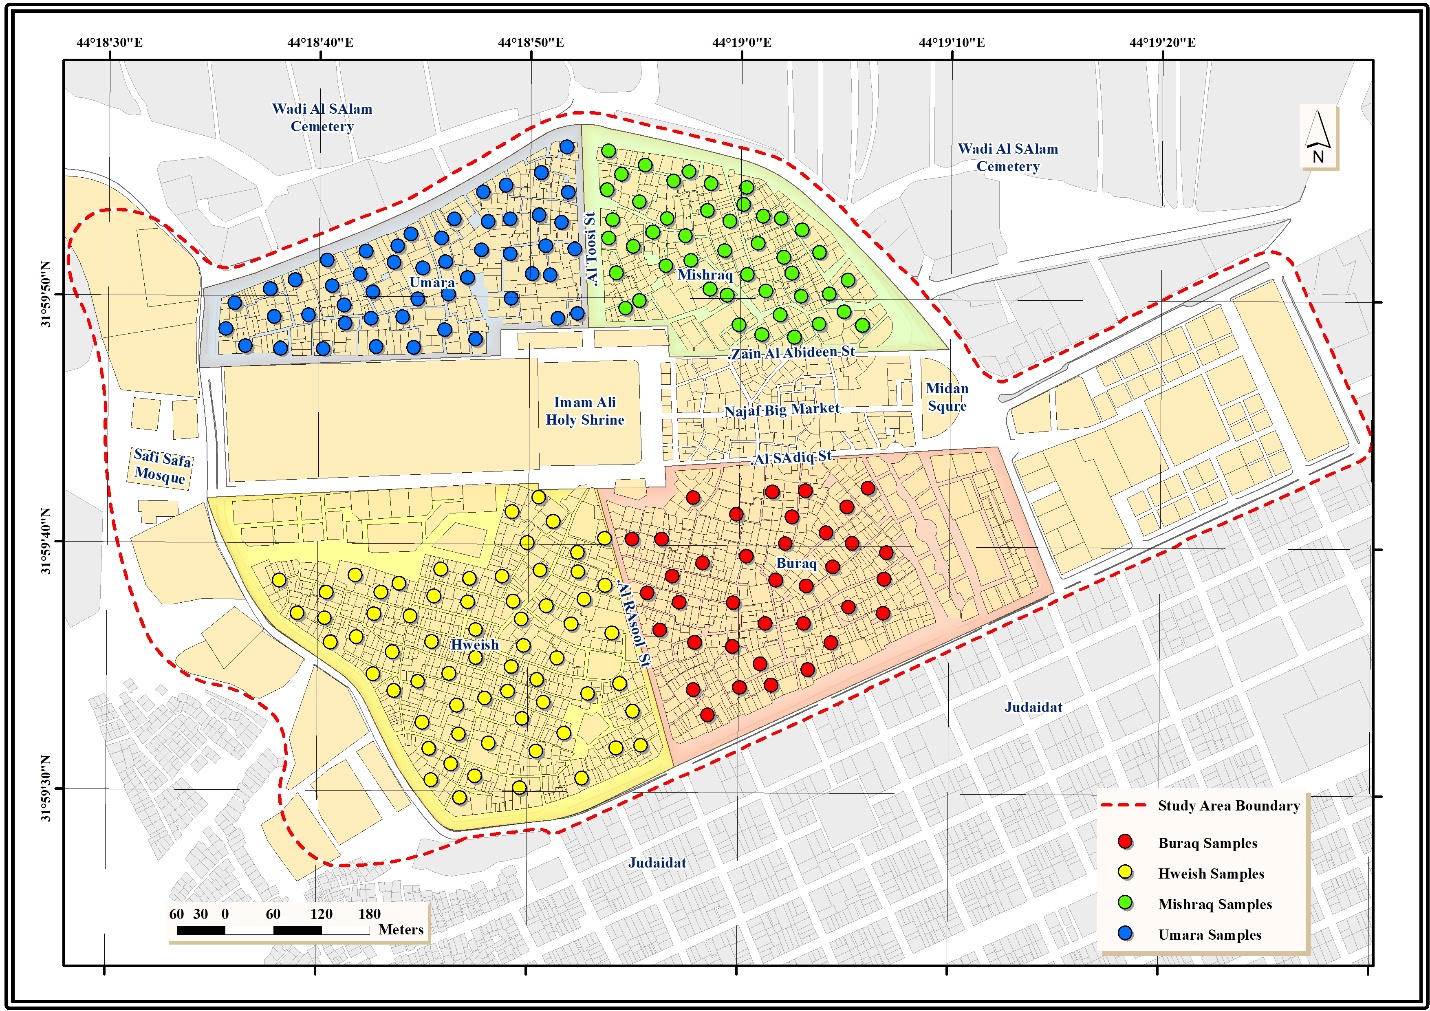
Figure 2: Distribution of water samples measured in this current study
Get the Data: Gather samples of tap water from several areas of the city. The Najaf Water Directorate or the Environment Directorate will provide you this information. Maps of the infrastructure on water networks. Space Analysis When you are using GIS, you place sample locations on a map. Determine the level of radon in water
3. The useful part
Water samples were collected from ancient areas in the old city located in Najaf governorate, Iraq. A sample of 1% was taken. Thereafter, the Rad 7 technique was utilized for the radon measurement. Durridge Company produces the RAD7, an electronic radon monitor that is very accurate. Many in environmental science and health physics use it to search for and measure the radioactive gas radon-222 (²²Rn), which occurs naturally when uranium-238 disintegrates in rocks, soil and groundwater. Operation modeThe RAD7 is a solid-state alpha spectrometry based semiconductor detector. When it decays, radon emits alpha particles. The RAD7 captures these alpha particles and determines the quantity of radon by observing the decay products: polonium-218 and polonium-214. How to Test for Radon in WaterThey test for radon in water with the RAD7 using an accessory called the RAD H2O. Using this procedure, radon can be removed from a water sample and transferred into a closed air system, which can be analyzed by the RAD7. It consists of the following steps:1. Removing Gas from Water Sample To test for water, place in a covered vial or an aeration box. Bubbles of air pressurize the water and push radon gas that is in dissolved in the water into the headspace. 2. Loop Circulating The Air The air, once without radon, is pumped in a loop around the bottle and the RAD7. 3. Search for radonThe RAD7 collects the alpha particles emitted as the radon breaks down. Then the device calculates how much radon is in the air. [9–10].
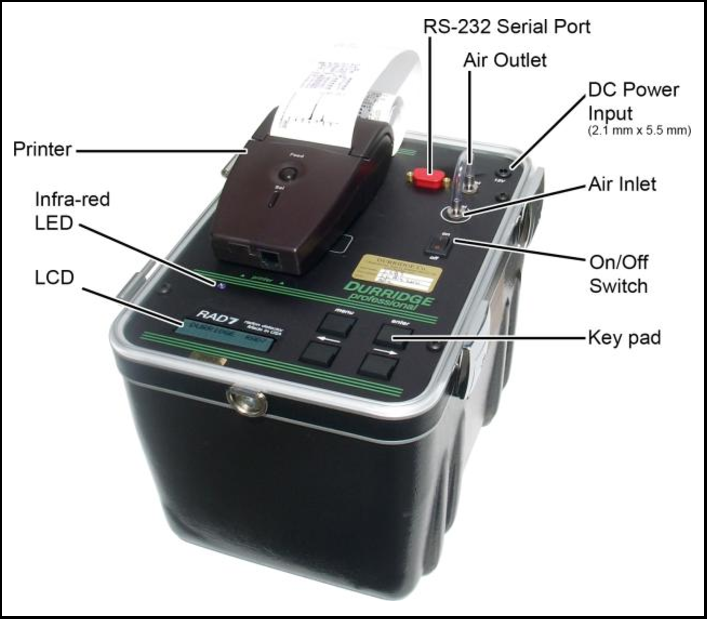
Table No. 1: Results of radon gas concentration in tap water in Al-Huwaisdistrict in Najaf
|
House number |
Radon concentration in water ) Bq/L( |
House number |
Radonconcentration in water) Bq/L( |
|
1 |
0.37 |
37 |
0.96 |
|
2 |
0.95 |
38 |
0.38 |
|
3 |
0.73 |
39 |
0.26 |
|
4 |
0.59 |
40 |
0.39 |
|
5 |
0.15 |
41 |
0.26 |
|
6 |
0.86 |
42 |
0.73 |
|
7 |
0.60 |
43 |
0.82 |
|
8 |
0.70 |
44 |
0.50 |
|
9 |
0.02 |
45 |
0.85 |
|
10 |
0.96 |
46 |
0.37 |
|
11 |
0.83 |
47 |
0.44 |
|
12 |
0.21 |
48 |
0.10 |
|
13 |
0.18 |
49 |
0.71 |
|
14 |
0.18 |
50 |
0.63 |
|
15 |
0.30 |
51 |
0.38 |
|
16 |
0.52 |
52 |
0.95 |
|
17 |
0.43 |
53 |
0.19 |
|
18 |
0.29 |
54 |
0.12 |
|
19 |
0.61 |
55 |
0.89 |
|
20 |
0.13 |
56 |
0.769 |
|
21 |
0.29 |
57 |
0.276 |
|
22 |
0.36 |
58 |
0.651 |
|
23 |
0.45 |
59 |
0.136 |
|
24 |
0.78 |
60 |
0.811 |
|
25 |
0.19 |
61 |
0.607 |
|
26 |
0.51 |
62 |
0.729 |
|
27 |
0.59 |
63 |
0.928 |
|
28 |
0.04 |
64 |
0.845 |
|
29 |
0.60 |
65 |
0.558 |
|
30 |
0.17 |
Maximum value Minimum value General average Permissible limit |
0.969 0.020 0.539 1.0 |
|
31 |
0.06 |
||
|
32 |
0.94 |
||
|
33 |
0.96 |
||
|
34 |
0.67 |
||
|
35 |
0.50 |
||
|
36 |
0.78 |
||
Table No. 2: Results of radon gas concentration in tap water in Al-Barakdistrict in Najaf
|
House number |
Radon concentration in water ) Bq/L( |
|
1 |
4.5 |
|
2 |
6.2 |
|
3 |
5.8 |
|
4 |
7.1 |
|
5 |
3.9 |
|
6 |
4.7 |
|
7 |
6.4 |
|
8 |
5.1 |
|
9 |
8.0 |
|
10 |
7.3 |
|
11 |
6.9 |
|
12 |
4.3 |
|
13 |
5.5 |
|
14 |
6.0 |
|
15 |
4.8 |
|
16 |
3.7 |
|
17 |
5.6 |
|
18 |
7.2 |
|
19 |
6.1 |
|
20 |
4.2 |
|
21 |
5.0 |
|
22 |
4.9 |
|
23 |
7.5 |
|
24 |
3.8 |
|
25 |
5.4 |
|
26 |
6.7 |
|
27 |
6.7 |
|
28 |
4.6 |
|
29 |
4.1 |
|
30 |
3.6 |
|
31 |
5.9 |
|
32 |
6.3 |
|
33 |
7.0 |
|
34 |
4.1 |
|
35 |
5.3 |
|
36 |
6.5 |
|
37 |
4.4 |
|
Maximum value |
8.0 |
|
Minimum value |
3.5 |
|
General average |
5.4 |
|
Permissible limit |
11 |
Table No. 3: Results of radon gas concentration in tap water in Al-Amara district in Najaf
|
House number |
Radon concentration in water ) Bq/L( |
House number |
Radon concentration in water ) Bq/L( |
|
1 |
0.37 |
26 |
0.51 |
|
2 |
0.95 |
27 |
0.59 |
|
3 |
0.73 |
28 |
0.04 |
|
4 |
0.59 |
29 |
0.60 |
|
5 |
0.15 |
30 |
0.17 |
|
6 |
0.86 |
31 |
0.06 |
|
7 |
0.60 |
32 |
0.94 |
|
8 |
0.70 |
33 |
0.96 |
|
9 |
0.02 |
34 |
0.67 |
|
10 |
0.96 |
35 |
0.50 |
|
11 |
0.83 |
36 |
0.78 |
|
12 |
0.21 |
37 |
0.96 |
|
13 |
0.18 |
38 |
0.38 |
|
14 |
0.18 |
39 |
0.26 |
|
15 |
0.30 |
40 |
0.39 |
|
16 |
0.52 |
41 |
0.26 |
|
17 |
0.43 |
42 |
0.73 |
|
18 |
0.29 |
43 |
0.82 |
|
19 |
0.61 |
44 |
0.50 |
|
20 |
0.13 |
45 |
0.85 |
|
21 |
0.29 |
46 |
0.37 |
|
22 |
0.36 |
47 |
0.44 |
|
23 |
0.45 |
48 |
0.10 |
|
24 |
0.78 |
49 |
0.71 |
|
25 |
0.19 |
50 |
0.63 |
|
Maximum value |
0.969 |
||
|
Minimum value |
0.020 |
||
|
General average |
0.539 |
||
|
Permissible limit |
1.0 |
||
Table No. 4: Results of radon gas concentration in tap water in Al-Mashraqdistrict in Najaf
|
House number |
Radon concentration in water ) Bq/L( |
House number |
Radon concentration in water ) Bq/L( |
||
|
1 |
0.35 |
26 |
0.54 |
||
|
2 |
0.91 |
27 |
0.61 |
||
|
3 |
0.68 |
28 |
0.06 |
||
|
4 |
0.58 |
29 |
0.63 |
||
|
5 |
0.11 |
30 |
0.20 |
||
|
6 |
0.83 |
31 |
0.08 |
||
|
7 |
0.57 |
32 |
0.93 |
||
|
8 |
0.69 |
33 |
0.98 |
||
|
9 |
0.03 |
34 |
0.64 |
||
|
10 |
0.95 |
35 |
0.47 |
||
|
11 |
0.81 |
36 |
0.76 |
||
|
12 |
0.19 |
37 |
0.94 |
||
|
13 |
0.16 |
38 |
0.42 |
||
|
14 |
0.22 |
39 |
0.28 |
||
|
15 |
0.31 |
40 |
0.36 |
||
|
16 |
0.49 |
41 |
0.30 |
||
|
17 |
0.44 |
42 |
0.71 |
||
|
18 |
0.32 |
43 |
0.79 |
||
|
19 |
0.59 |
44 |
0.55 |
||
|
20 |
0.12 |
45 |
0.87 |
||
|
21 |
0.27 |
Maximum value |
0.98 |
||
|
22 |
0.38 |
Minimum value |
0.03 |
||
|
23 |
0.43 |
General average |
0.54 |
||
|
24 |
0.80 |
Permissible limit |
1.0 |
||
|
25 |
0.21 |
||||
Discussion
The numbers above make it clear that not all water supplies contain the same quantity of radon gas. There are several reasons why radon levels in tap water fluctuate. The geology of the region from which the water originates is one of the primary reasons for this. Water that runs through granite or other rocks with high levels of uranium is likely to pick up more radon gas. The depth and the type of the water source either from a well deep underground or a surface pond — are also big factors. Radon contents are generally higher in deeper water sources because these sources will have been in contact with radon-emitting rock for a longer period of time. The amount of radon that can be dissolved in water can also be influenced by the temperature and pressure of the water. Additionally, water distribution system age and condition can affect radon levels. That’s because older pipes or structures might assist with radon buildup or seepage. Finally, variations in the seasons and amount of water used can lead to fluctuating radon levels. That is what makes it a variable which has to be monitored on a regular basis [11–15].
Conclusion
The radon gas content in tap water samples from the Old City of Najaf proved to be within the permitted limits established by international radiation regulations such as the International Atomic Energy Agency and the World Health Organization. This means that radon in drinking water does not currently pose a health risk for people drinking water from this location whether they drink at home, in the midwest as a whole or anywhere. The findings are good news for the Old City’s water network. They also demonstrate that the geology and hydrogeology in the area are stable as it relates to radon releases. Though the results were good, the study “indicates that it wasn’t bad to be testing levels of radon regularly to make sure everyone is safe,” especially as certain environmental factors change or there is potential for changes in water sources, Dr. Joyce said. It also implies that more of us should understand how critical it is to promptly find naturally occurring contaminants in drinking water.
References:
[1] Alnafiey, M. S. A. (2014). Radiological Assessment Associated with Vegetable Farming in Cameron Highlands and Seberang Perai. (PhD Thesis), Universiti Sains Malaysia.
[2] Zhang, X., Feng, L., Zhang, Y., Feng, Y., Wang, B., Zhou, H., & Zhou, S. (2024). Factors influencing the dissolution rate of radon gas in water. Journal of Environmental Radioactivity, 280, 107542.
[3] Hem, J. D. (1985). Study and interpretation of the chemical characteristics of natural water (Vol. 2254): Department of the Interior, US Geological Survey.
[4] Hamed, N., Yassin, S., & Shabat, M. (2005). Measurement of radon concentration in soil at North Gaza. Unpublished Master’s Thesis). The Islamic University of Gaza, Palestine.
[5] Manawi, Y., Hassan, A., Atieh, M. A., & Lawler, J. (2024). Overview of radon gas in groundwater around the world: Health effects and treatment technologies. Journal of Environmental Management, 368, 122176.
[6] Bonotto, D. M., & Caprioglio, L. (2002). Radon in groundwaters from Guarany aquifer, South America: environmental and exploration implications. Applied Radiation and Isotopes, 57(6), 931-940.
[7] Inácio, M., Soares, S., & Almeida, P. (2017). Radon concentration assessment in water sources of public drinking of Covilhã’s county, Portugal. Journal of Radiation Research and Applied Sciences, 10(2), 135- 139.
[8] Abuelhia, E. (2018). Assessment of radiation dose from radon ingestion and inhalation in commercially bottled drinking water and its annual effective dose in Eastern Province, Saudi Arabia. International Journal of Environmental Health Research, 29(2), 164- 172.
[9] Malakootian, M., Darabi Fard, Z., & Rahimi, M. (2015). Determination of radon concentration in drinking water resources of villages nearby Lalehzar fault and evaluation the annual effective dose. Journal of Radioanalytical and Nuclear Chemistry, 304, 805-815.
[10] Latef, H. (2012). The Future of the Demographic Size of Al- Najaf Province A study in the Population Projection. Journal of Education College Wasit University, 1(12), 287-317.
[11] Dosh, R. J., Hasan, A. K., & Abojassim, A. A. (2023). Health effect of radon gas in water on children at Al-Najaf schools. International Journal of Nuclear Energy Science and Technology, 16(2), 143-156.
[12] Sissakian, V. K., Al-Rammahi, H., & Mohammad, M. K. (2022). Genesis of the sinkholes at Al-Najaf Governorate, South Iraq. The Iraqi Geological Journal, 74-87.
[13] Tan, Y., & Xiao, D. (2011). A novel algorithm for quick and continuous tracing the change of radon concentration in environment. Review of Scientific Instruments, 82(4), 043503-043501to 043503-043504
. [14] Kumar, A., Narang, S., Mehra, R., & Singh, S. (2016). Assessment of radon concentration and heavy metal contamination in groundwater samples from some areas of Fazilka district, Punjab, India. Indoor and Built Environment, 26(3), 368-374.
[15] Onoja, E. D., Onyekachi, G. A., Ejila, A. O., Okoh, P., & Jack, Z. K. (2024). Measurement of Radon Gas Concentration in Sources of Drinking Water in Makurdi, Benue State, Nigeria Using Radon Detector (RAD7). UMYU Scientifica, 3(3), 322-332