
High Doses of Vitamin D and Vitamin C and Their Effect on Thyroid Hormones and Body Mass in Male Domestic Rabbits
الجرعات العالية من فيتامين د وفيتامين ج وتأثيرها على هرمونات الغدة الدرقية وكتلة الجسم لدى ذكور الأرانب المحلية
Njia Mild A. Rajab Aser1, Wedad Mohamed Omran Alkut1, Nada Mukhtar Rifai1, and Khayriya Mohammed Al Bakouri1
1 Department of Biology/ Faculty of Sciences, El-mergib University, El-Khoms , Libya
Email: suaadomm@yahoo.com
DOI: https://doi.org/10.53796/hnsj66/23
Arabic Scientific Research Identifier: https://arsri.org/10000/66/23
Volume (6) Issue (6). Pages: 345 - 354
Received at: 2025-05-07 | Accepted at: 2025-05-15 | Published at: 2025-06-01
Abstract: Vitamin D is essential for the normal functioning of many organs, including the thyroid gland. Therefore, vitamin D deficiency is a risk factor for many thyroid disorders, as well as autoimmune thyroid diseases and thyroid cancer. Many doctors recommend vitamin D supplementation to prevent these diseases. However, some people overuse it without considering its potential toxicity. For this reason, this study used male rabbits to investigate the effects of different doses of vitamin D3 on thyroid hormones. Male rabbits were injected with vitamin D3 for three months at doses of 200,000, 400,000, 600,000, and 800,000 IU monthly. The rabbits were then divided into five groups. The first group was a control group, while the second and third groups were injected with different doses of vitamin D only, while the third and fourth groups were injected with different doses of vitamin D + vitamin C (1000 mg). The results of this study showed a significant increase in the levels of thyroid hormones (T3 and T4) in the first and second groups only. With a change in body mass without any statistical significance.
Keywords: Vitamin D, Vitamin C, Thyroid hormones, Body mass, Rabbit.
المستخلص: فيتامين د ضروري للأداء الطبيعي للعديد من أعضاء الجسم، بما في ذلك الغدد وخاصةً الغدة الدرقية. لذلك، فإن نقص فيتامين د هو عامل خطر للعديد من اضطرابات الغدة الدرقية، وكذلك أمراض الغدة الدرقية المناعية الذاتية وسرطان الغدة الدرقية. يوصي العديد من الأطباء بمكملات فيتامين د للوقاية من هذه الأمراض. ومع ذلك، فإن بعض الناس يفرطون في استخدامه دون مراعاة سميته المحتملة. لهذا السبب، استخدمت هذه الدراسة الأرانب الذكور للتحقيق في آثار جرعات مختلفة من فيتامين د3 على هرمونات الغدة الدرقية. حيث أجريت هذه الدراسة في كلية العلوم، جامعة المرقب. تم حقن الأرانب الذكور بفيتامين د3 لمدة ثلاثة أشهر بجرعات 200000 و400000 و600000 و800000 وحدة دولية شهريًا. ثم تم تقسيم الأرانب إلى خمس مجموعات. كانت المجموعة الأولى مجموعة ضابطة، بينما تم حقن المجموعتين الثانية والثالثة بجرعات مختلفة من فيتامين د فقط، بينما تم حقن المجموعتين الرابعة والخامسة بجرعات مختلفة من فيتامين د مع فيتامين ج (1000 مجم). أظهرت نتائج هذه الدراسة ارتفاعاً معنوياً في مستويات هرمونات الغدة الدرقية في المجموعتين الأولى والثانية فقط، مع تغير في كثلة الجسم دون أي دلالة إحصائية.
الكلمات المفتاحية: فيتامين د، فيتامين ج، هرمونات الغدة الدرقية، كتلة الجسم، الأرانب.
Introduction:
Vitamin D toxicity, also known as hypervitaminosis D, is an uncommon but potentially fatal illness that develops when the body has an excessive quantity of vitamin D (1). Vitamin D toxicity is often induced by high dosages of vitamin D supplements, rather than food or sun exposure (2). This is because the body limits the amount of vitamin D generated by sunlight, and even diets supplemented with supplements do not contain high levels of vitamin D (3). The most serious result of vitamin D poisoning is a buildup of calcium in the body (hypercalciuria) (4) This results in weakness, frequent urination, and nausea and vomiting (5). Bone pain and kidney issues, including the development of calcium stones, may develop as symptoms worsen (6). Toxicology caused by calcidiol, calcitriol, cholecalciferol (vitamin D3), or ergocalciferol (vitamin D2) is known as hypervitaminosis D (7). Either dietary supplements or treatment with vitamin D2, D3, or D3 metabolites might result in excessive vitamin D intake (8). The physiologically active form of vitamin D3 is 1,25-dihydroxycholecalciferol, or calcitriol. Calcium, phosphate, and reabsorption in the kidney are all influenced by vitamin D (9). Consequently, hypercalcemia may result from high levels of vitamin D derived from either endogenous or exogenous sources. The production of thyroid hormones, which are necessary for the proper operation of physiological systems, is largely dependent on the thyroid gland (10). It is yet unknown how vitamin D and thyroid function interact (11). The thyroid gland is one of the numerous organs that depend on vitamin D for proper operation (12). Thyroiditis (14), as well as hyperthyroidism in Graves’ disease (13) has been found to benefit from vitamin D supplementation. To date, a number of human investigations have also been carried out to assess vitamin D’s involvement in autoimmune thyroid disorders (15–16). In addition, it has been observed that patients with Graves’ disease were more likely to be vitamin D deficient (17). Thyroxine (T4) and triiodothyronine (T3), the primary hormones produced by the thyroid gland, regulate growth, metabolism, and several other bodily processes. The hypothalamic-pituitary-thyroid axis is a self-regulating circuit that is made up of the thyroid, anterior pituitary, and hypothalamus. To preserve appropriate feedback mechanisms and internal balance, thyroid-stimulating hormone (TSH) from the anterior pituitary gland, thyroid-releasing hormone (T4) from the thyroid gland, and thyrotropin-releasing hormone (TRH) from the hypothalamus all function in synchronous harmony (18). Therefore, the aim of this study was to examine the effects of high vitamin D and vitamin C dosages on thyroid hormone function.
2. Material and Methods:
2.1 Drugs Used
Vitamin D (200,000 IU/L) was purchased from local pharmacies (Bouchara-recordari, France). Vitamin C (1000 mg) was purchased from Superdyn, Europe, Italy.
2.2 Experimental Animals
This study included approximately 40 domestic male rabbits. Their weight ranged from 800 to 1,200 grams, and their ages ranged from four to six months. The rabbits were housed in dedicated cages within a room with conventional settings, such as a ventilation system, a temperature range of 22–25°C, and lighting controlled to provide 12 hours of light and 12 hours of darkness. The rabbits had unlimited access to water and food. The animals were then given a two-week adaptation period to the experimental environment, during which their health was monitored. The animals’ weights were taken before the start of the experiment. The animals were divided into five groups (each containing eight animals) and treated as follows: Group 1: Control group, where each animal was injected with 100 mg of corn oil for three months (Experimental duration). Group 2: For three months, each animal received weekly vitamin D3 injections (200,000 IU/ml per week) for four times a month .Group 3: Each animal received vitamin D3 injections (200,000 IU/ml) every ten days for three months (three times a month). Group 4: For three months, each animal received (200,000 IU/ml) vitamin D3 injections every fifteen days (twice a month).This group was also given vitamin C received oral (1,000 mg) twice a month.
Group 5: Each animal received (200,000 IU/ml) vitamin D3 injections once a month for three months. This group also received oral vitamin C (1,000 mg) once a month, in conjunction with vitamin D3 doses.
2.3 Statistical analysis
The findings were presented in the form of mean ± SD. One-way analysis of variance (ANOVA) was used to analyze data for comparisons between several variables. For the comparison of significance between groups, Duncan’s test was used as a post hoc test according to the statistical package program (SPSS version 25).value of less than 0.05 was considered statistically significant.
. Results.3
Clinical signs. 3.1
Some negative behavioral effects were observed in experimental animals after injection with high doses of vitamin D. For example, increased drinking water and decreased feed intake occurred with increased duration of the dose. Difficulty moving was also observed in the final weeks, along with weight loss.
3.2 Change in the level of vitamin D
The study results showed significant differences (P < 0.01) in vitamin D3 levels between the study sample groups. Animals in Vitamin D3 levels in Group 2 were significantly higher (P < 0.01) (103.5 ± 1.2) than in the control group (Group 1), with an almost 96% rise rate. Vitamin D levels in animals in Group 3 were significantly higher (P < 0.01) at a rate of almost 101% (108.3 ± 1.03) than in the control group (Group 1). Vitamin D3 levels in animals in group 4 (101.0 ± 0.71) were significantly higher (P<0.01) than in the control group, representing a 93% increase. Vitamin D levels in animals in group 5 were likewise significantly higher (P<0.01) (102.7 ± 1.45) than in the control group, a 95% increase. As a result, we observe that the notable rise in groups 4 and 5 was quite comparable. These are the groups that were given vitamin C along with vitamin D as described in the experimental steps (see Table 1).
Table: Compressions Test Results of VIT-D3
|
Mean |
Std. Error |
Change of the control group |
|||
|
Mean Difference |
Sig. |
||||
|
group-1 |
7.5675 |
1.15283 |
– |
– |
|
|
group-2 |
103.5000 |
1.19024 |
↑95.93250 |
0.000** |
|
|
group-3 |
108.2500 |
1.03078 |
↑100.68250 |
0.000** |
|
|
group-4 |
101.0000 |
.70711 |
↑93.43250 |
0.000** |
|
|
group-5 |
102.6667 |
1.45297 |
↑95.09917 |
0.000** |
|
** significant at 0.01 level -* significant at 0.05 level
Table1: Change in the level of vitamin D3 between groups. Bars followed by the different letter are significantly different (p < 0.01).
3.2.1 Estimation of biochemical parameters:
Impact of vitamin D3 on thyroid hormones and TSH was calculated and shown as Mean± SD, When contrast to the control group.
3.3. Change in the level of thyroid indicators:
3.3.1 Change in the level of T3 indicator
Table 2: Compressions Test Results of T3
|
|
Mean |
Std. Error |
Chang of the control group Mean Difference Sig |
|
|
Group1 |
0.7275 |
0.07111 |
||
|
Group2 |
1.2100 |
0.02082 |
↑0.48250 |
0.000** |
|
Group3 |
1.1815 |
0.03553 |
↑0.45402 |
0.000** |
|
Group4 |
0.8715 |
0.08227 |
||
|
Group5 |
0.8333 |
0.04565 |
||
** Significant at 0.01 level -* significant at 0.05 level
When compared to all groups, it was shown that the animals in group-2 had a significantly higher level of T3 (1.21 ±0.02) (P<0.01), with an approximate increase rate of 0.48%. Furthermore, the T3 level in group 3 animals increased significantly (P<0.01) (1.18±0.04) in comparison to the control group, with an estimated percentage increase of 0.45%. However, the indicator T3 shows no significant difference (P>0.05) between the control group’s means and those of the other research groups.
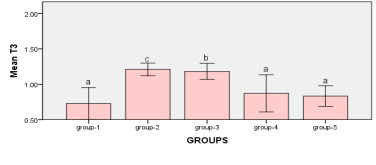
Figure1: measurements between Groups Bars followed by the same letter are not significantly different (p > 0.05)
3.3.2 Change in the level of T4 indicator
Table 3: Compressions Test Results of T4
|
Mean |
Std. Error |
Chang of the control group Mean Difference Sig |
||
|
Group1 |
14.2350 |
2.06667 |
||
|
Group2 |
27.1475 |
1.35349 |
↑12.91250 |
0.000** |
|
Group3 |
16.9200 |
2.01314 |
||
|
Group4 |
15.3950 |
2.08878 |
||
|
Group5 |
10.3400 |
1.48041 |
||
** significant at 0.01 level -* significant at 0.05 level
It was noted that there was a significant increase (P<0.01) in the level of T4 in the animals of group-2 (27.2 ±1.4) when compared to the all groups, the increase rate was 13% approximately. While, there is no significant difference (P>0.05) between the means of the control group and the rest of the study groups according to the indicator T4.
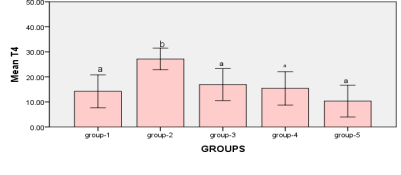
Figure2: measurements between Groups Bars followed by the different letter are significantly different (p < 0.05)
3.3.3 Change in the level of TSH indicator
Table 4: Compressions Test Results of TSH
|
Mean |
Std. Error |
Mean Difference and Sig |
|||
|
Group1 |
0.1900 |
0.01472 |
|||
|
Group2 |
0.0505 |
0.01198 |
↓0.13950 |
0.000** |
|
|
Group3 |
0.0683 |
0.00601 |
↓0.12167 |
0.000** |
|
|
Group4 |
0.0850 |
0.00645 |
↓0.10500 |
0.000** |
|
|
Group5 |
0.1760 |
0.00627 |
|||
** significant at 0.01 level -* significant at 0.05 level
When compared to the control group, it was observed that the TSH level in the animals in group-2 decreased significantly (P<0.05) (0.05 ±0.012), with a reduction rate of roughly 0.14%. When comparing the animals in group-4 (0.085±0.006) to the control group, it was observed that the TSH level decreased significantly (P<0.01), with a reduction rate of almost 0.11%. When compared to the control group, the TSH level in the animals in group 3 (0.068 ±0.006) was shown to have decreased significantly (P<0.01), with a reduction rate of roughly 0.12%. According to the indicator TSH, however, there is no significant difference (P>0.05) between the means of the control group and the other research groups.
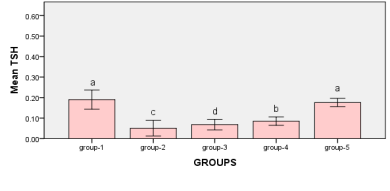
Figure 3: measurements between Groups Bars followed by the same letter are not significantly different (p > 0.05)
4. The relationship between the vitamin D3 and weights
When studying the correlation between indicators of measuring vitamin D and indicators of weights, The findings demonstrated that there is no statistically significant relationship (P>0.05) between vitamin D measurement indicators and weight measurement indicators.
Table 5 : relationship between the vitamin D3 index with weights
|
Vitamin D |
||
|
weight |
Pearson Correlation |
0.188 |
|
Sig. (2-tailed) |
0.441 |
|
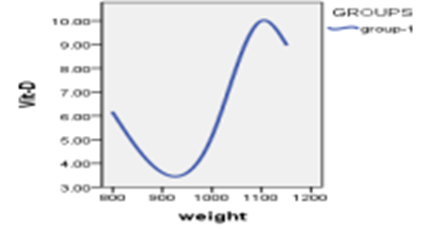
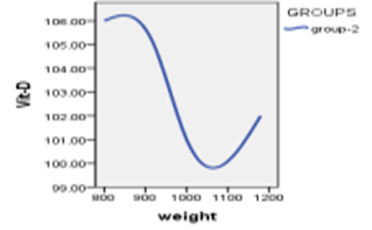
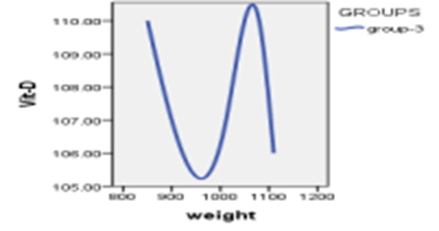
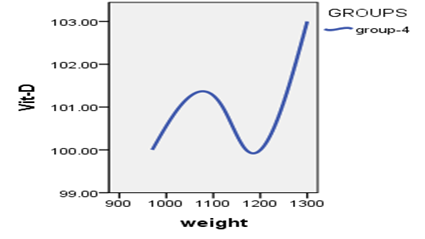
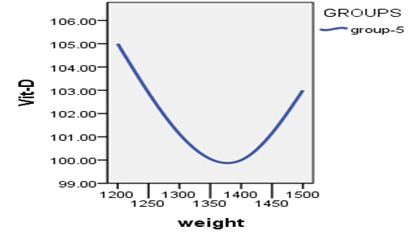
Figure 4: Relationship between vitamin D3 indexes whit weights
Discussion:-4
Because of its pleiotropic qualities and widespread receptor expression, vitamin D has been demonstrated to have positive effects on a number of systems (19). However, in all cases, vitamin D overdose (through injection) was the cause of vitamin D toxicity. Vitamin D toxicity is a rare and extremely serious condition that occurs when large doses of vitamin (D) are administered over long periods. In this study, it was observed that thyroid hormones (T4 and T3) were significantly increased. This was demonstrated by animals in group 2 after receiving large doses of vitamin D injections. Animals in groups 2 and 3, which received only vitamin D injections, also showed elevated levels of T3, while animals in groups 4 and 5, which received vitamin D injections with vitamin C, did not show any significant increase in thyroid hormones compared to the control group. Therefore, we note that the increase in thyroid hormones in the blood was not significantly affected by large doses of vitamin D in the presence of vitamin C. Study groups 4 and 5 also clearly demonstrated that vitamin C is necessary for the body’s cells to absorb vitamin D and lower its levels in the blood. This is consistent with a study conducted by (Eileen Hill, 2023) (20). This evidence suggests that hypervitaminosis D alone, without vitamin C, increases levels of thyroid hormones (T4 and T3). These findings are consistent with other studies, which have shown that administering high doses of vitamin D (60,000 IU) weekly is beneficial in the autoimmune thyroid disorder Hashimoto’s thyroiditis (AITD), which is characterized by hypothyroidism, manifested by elevated thyroid hormone levels with high doses of vitamin D (21). Another study has shown that vitamin D supplementation is very beneficial in animal models of Graves’ disease and thyroiditis (13, 14). To date, several studies have been conducted to evaluate the role of vitamin D in thyroid disease. According to genetic research, variations in the vitamin D receptor (VDR) and other genes related to vitamin D signaling are linked to a higher risk of developing Hashimoto’s thyroiditis (15–16). TSH (thyroid-stimulating hormone) influences thyroid hormones, therefore the more thyroid hormones there are in the blood, the lower the TSH level (negative feedback).This was shown in this study and is corroborated by a number of other investigations, such as (18,22)..
These results conflict with another study in rats, which confirmed that vitamin D3 administration enhanced TRH-stimulated TSH secretion in pituitary cells. According to these findings, high doses of vitamin D may affect central and peripheral TSH and thyroid-stimulating hormone secretion (23). Although not statistically significant, this study also found that all study animals had a lower body mass than the control group. The study demonstrated that higher vitamin D levels led to lower fat content, which in turn led to lower body mass. One explanation for this decreased body mass is that excess vitamin D, which may be toxic, increases levels of thyroid hormones, which are essential for accelerating adipose tissue metabolism and energy production, aiding weight loss and obesity prevention (24)).
According to experimental research, vitamin D directly affects thyroxine-binding globulin, an enzyme required in target tissues for the conversion of T4 to T3. T3, the hormone most effective at triggering tissue fat metabolism, rises as a result (25). Vitamin D has hydrophobic properties that allow it to escape from the bloodstream. Because it is a fat-soluble vitamin, adipose tissue can store it, which in turn leads to increased body fat, measured by body mass index (BMI). As the percentage of stored body fat increases, more vitamin D is stored and drawn from the bloodstream, especially in the presence of vitamin C. For this reason, vitamin D levels are often low in obese individuals. As a result, vitamin D deficiency is common in people with a high BMI (26). However, according to our research, body weight decreases when blood vitamin D levels rise. Getting adequate vitamin D may help reduce body fat and aid in weight loss, according to several researches. In one study, 218 obese and overweight women were tracked for a year. A placebo was given to half of the ladies, and the other half got vitamin D supplements. All followed a calorie-restricted diet and exercised. At the conclusion of the study, researchers discovered that women who had adequate blood levels of vitamin D lost an average of 7 pounds (3.2 kg) more weight than those who did not (27). Vitamin D and body mass appear to be inversely related, with a 10% increase in BMI leading to a 4% increase in vitamin D deficiency. There are various causes of vitamin D deficiency in obese individuals [28, 29]. This was fully demonstrated in this study, but in reverse. When vitamin D levels rose to toxic levels, the experimental animals experienced weight loss, but without any statistical significance compared to the control group. To explain this result, we point to a study that confirms that certain enzymes are necessary to convert vitamin D into its active form, and the levels of these enzymes may differ between obese and non-obese people. Calcium and vitamin D supplements stimulate certain enzymes responsible for programmed cell death within fat cells, reducing fat accumulation and the amount of adipose tissue in obese people. (30).
According to some additional research, vitamin D may also prevent the body from producing new fat cells (31). It may also prevent fat cells from storing fat, which would effectively prevent the accumulation of fat (32). In addition to influencing the transcription factor PPAR (peroxisome proliferator-activated receptor gamma), which controls fat metabolism, vitamin D can alter the production and breakdown of lipids (33). Additionally, vitamin D has been shown to help control hormone, enzyme, and certain neurotransmitter levels, which helps reduce body fat and encourage weight reduction (34). On the other hand, some research indicates that vitamin D increases levels of serotonin in the brain, a neurotransmitter that affects everything, as it is responsible for regulating mood and sleep. It also plays a role in reducing appetite, which may aid weight loss by reducing food intake. High levels of vitamin D in the blood also increase testosterone levels, which increases metabolic rates, burns calories, and breaks down fat cells. This, in turn, reduces body fat and helps maintain weight. (35).
References:
1-Parjeet Kaur, Sunil Kumar Mishra and Ambrish Mithal (2015): Vitamin D toxicity resulting from overzealous correction of vitamin D deficiency, Clinical Endocrinology 83, 327–331
2-Chiricone, D., De Santo, N.G. & Cirillo, M. (2003): Unusual cases of chronic intoxication by vitamin D. Journal of Nephrology, 16, 917–921
3-Klontz, K.C. & Acheson, D.W. (2007): Dietary supplementinduced vitamin D intoxication. New England Journal of Medicine, 357, 308 309
4-Chambellan-Tison, C., Horen, B., Plat-Wilson, G. et al. (2007): Severe hypercalcemia due to vitamin D intoxication. Archives de Pediatrie, 14, 1328–1332. )
5- Ross, A.C., Taylor, C.L., Yaktine, A.L. et al., editors. (2011): Dietary Reference Intakes for Calcium and Vitamin D. Institute of Medicine (US) Committee to Review Dietary Reference Intakes for Vitamin D and Calcium; Washington (DC): National Academies Press (US
6-Parjeet Kaur, Sunil Kumar Mishra and Ambrish Mithal. (2015): Vitamin D toxicity resulting from overzealous correction of vitamin D deficiency Division of Endocrinology and Diabetes, Medanta, the Medicity, Gurgaon, India Clinical Endocrinology. 83, 327–331.
7- Mirjana Babi´c Leko , Iva Jureško, Iva Rozi´c, Nikolina Plei´c , Ivana Gunjaˇca and Tatijana Zemunik. (2023): Vitamin D and the Thyroid: A Critical Review of the Current Evidence, Int. J. Mol. Sci. 2023, 24, 3586.
8-Bikle, D.D. (2014): Vitamin D metabolism, mechanism of action, and clinical applications. Chem. Biol., 21, 319–329.
9-Stöcklin, E.; Eggersdorfer, M. (2013): Vitamin D, an essential nutrient with versatile functions in nearly all organs. Int. J. Vitam. Nutr. Res., 83, 92–100.
10-Fekete, C.; Lechan, R.M. (2014): Central regulation of hypothalamic-pituitary-thyroid axis under physiological and pathophysiological conditions. Endocr. Rev., 35, 159–194.
11-Nettore, I.C.; Albano, L.; Ungaro, P.; Colao, A.; Macchia, P.E. (2017): Sunshine vitamin and thyroid. Rev. Endocr. Metab. Disord., 18, 354-347
12-Taheriniya, S.; Arab, A.; Hadi, A.; Fadel, A.; Askari, G. (2021): Vitamin D and thyroid disorders: A systematic review and meta-analysis of observational studies. BMC Endocr. Disord, 21, 1–12.
13-Misharin, A.; Hewison, M.; Chen, C.R.; Lagishetty, V.; Aliesky, H.A.; Mizutori, Y.; Rapoport, B.; McLachlan, S.M. (2009): Vitamin D deficiency modulates Graves’ hyperthyroidism induced in BALB/c mice by thyrotropin receptor immunization. Endocrinology, 150, 1051–1060.
14-Liu, S.; Xiong, F.; Liu, E.; Zhu, M.; Lei, P. (2010): Effects of 1, 25-dihydroxyvitamin D3 in rats with experimental autoimmune thyroiditis. Nan Fang Yi Ke Da Xue Xue Bao, 30, 1573–1576.
15-Lopez, E.R.; Zwermann, O.; Segni, M.; Meyer, G.; Reincke, M.; Seissler, J.; Herwig, J.; Usadel, K.H.; Badenhoop, K. (2004): A promoter polymorphism of the CYP27B1 gene is associated with Addison’s disease, Hashimoto’s thyroiditis, Graves’ disease and type 1 diabetes mellitus in Germans. Eur. J. Endocrinol., 151, 193–197.
16-Inoue, N.; Watanabe, M.; Ishido, N.; Katsumata, Y.; Kagawa, T.; Hidaka, Y.; Iwatani, Y. (2014): The functional polymorphisms of VDR, GC and CYP2R1 are involved in the pathogenesis of autoimmune thyroid diseases. Clin. Exp. Immunol, 178, 262–269.
17-Xu, M.Y.; Cao, B.; Yin, J.; Wang, D.F.; Chen, K.L.; Lu, Q. Bin. (2015): Vitamin D and Graves’ disease: A meta-analysis update. Nutrients, 7, 3813–3827.
18-Shahid MA, Ashraf MA, Sharma S. Singh S, Haq N, Sandhu S. StatPearls. (2025): Physiology, Thyroid Hormone StatPearls Publishing; Treasure Island (FL): Jan 19, 2025. Thyroid Disease and Pregnancy
19-Tejaswini Ashok , Vishnu Palyam , Ahmad T. Azam , Oladipo Odeyinka , Rasha Alhashimi , Sankeerth Thoota , Ibrahim. (2022). Relationship Between Vitamin D and Thyroid: An Enigma. DOI: 10.7759/cureus.21069. Categories: Endocrinology/Diabetes/Metabolism, Internal Medicine, Nutrition.
20-Aileen Hill¹´², Christina Starchl³, Ellen Dresen⁴, Christian Stoppe⁴´⁵ and Karin Amrein³* (2023): An update of the effects of vitamins D and C in critical illness. Front. Med., 11 January 2023. Sec. Intensive Care Medicine and Anesthesiology Volume 9 – 2022. 14-15-16-17-19
21-Brent GA.J Clin Invest. (2012): “Mechanisms of thyroid hormone action” Sep; 122 (9):3035-43.
22- D’Emden, M.C.; Wark, J.D. 1987: 1,25-Dihydroxyvitamin D3 enhances thyrotropin releasing hormone induced thyrotropin secretion in normal pituitary cells. Endocrinology, 121, 1192–1194.
23-Njia M. Ali Rajab, Mirela Ukropina, Maja Cakic- Milosevic. (2015): Histological and Ultrastructural alteration of rat thyroid gland after short-term treatment with high doses of thyroid hormones. Institute of Zoology, Faculty of Biology University of Belgrade, 11000 Belgrade.
24- Alrefaie, Z.; Awad, H. (2015): Effect of vitamin D3 on thyroid function and de-iodinase 2 expression in diabetic rats. Arch. Physiol. Biochem., 121, 206–209.
25-Mai XM, Chen Y, Camargo CA, Langhammer (2012). Cross-sectional and prospective cohort study of serum 25-hydroxyvitamin D level and obesity in adults. Am J Epidemiol;175(10):1029–36 May 15
26-Gallagher JC, Yalamanchili V, Smith LM. Gallagher JC, et al. J. (2013). The effect of vitamin D supplementation on serum 25(OH) D in thin and obese women. Steroid Biochem Mol Biol. 2013 Jul; 136:195-200. doi: 10.1016/j.jsbmb.2012.12.003. Epub 2012 Dec 11. J Steroid Biochem Mol Biol.
27-Trevor Stokes. (2022): Obesity Is Linked to Vitamin D Deficiency. Retrieved on the 28th of September,
28-Sabrina Ait Gacem and Moyad Jamal Shahwan. (2022): Vitamin D and Obesity. Retrieved on the 28th of September, 2022
29-Simon Vanlint. (2013): Vitamin D and Obesity. PMCID: PMC3705328 PMID: 23519290
30-De Oliveira LF, de Azevedo LG, da Mota Santana J, de Sales LPC, Pereira-Santos M. (2020): Obesity and overweight decreases the effect of vitamin D supplementation in adults: systematic review and meta-analysis of randomized controlled trials. Mar; 21(1):67-76.
31– Richard J Wood 1 Nutr Rev. Jan (2008): Vitamin D and adipogenesis: new molecular insights. 2008 Jan; 66 (1):40-6.
32-Eugene Chang 1 , Yangha Kim 2. (2016): Vitamin D decreases adipocyte lipid storage and increases NAD-SIRT1 pathway in 3T3-L1 adipocytes. 2016 Jun; 32(6):702-8.
33-Pelczynska M, Grzelak T, Sperling M, Kr egielska-Naro ˛ zna M, Bogda _ nski P, Czy- zewska K. (2020): Evaluation of vitamin D fractions in obese hypertensive patients. Int J _ Environ Res Public Health 17(5) Mar 1
34-Rhonda P Patrick ¹, Bruce N Ames¹. (2014): Vitamin D hormone regulates serotonin synthesis. Part 1: relevance for autism. 2014 Jun; 28 (6):2398-413.
35-Rachael Link. (2022): Can Vitamin D Help You Lose Weight? Retrieved on the 28th of September, 2022