
Assessment of Macular Thickness Changes in Diabetic Retinopathy after Cataract Surgery
تقييم التغيرات في سُمك البقعة الصفراء في اعتلال الشبكية السكري بعد جراحة الساد
Najla Abdusalm Almabrouk1, Algharib Albaghdadi Alshraa1, Maisoon Daloub1
1 Tripoli University, Libya.
DOI: https://doi.org/10.53796/hnsj68/28
Arabic Scientific Research Identifier: https://arsri.org/10000/68/28
Volume (6) Issue (8). Pages: 436 - 449
Received at: 2025-07-07 | Accepted at: 2025-07-15 | Published at: 2025-08-01
Abstract: This study aimed to evaluate macular thickness changes following cataract surgery in diabetic patients using optical coherence tomography (OCT) and to assess the influence of diabetic retinopathy (DR) severity and prior laser photocoagulation on postoperative outcomes. A retrospective cohort analysis was conducted on 104 eyes of diabetic patients who underwent uneventful phacoemulsification at Tripoli Eye Hospital between 2018 and 2019. Central subfield macular thickness (CSMT) was measured preoperatively and at multiple postoperative intervals. Macular edema (ME), defined as a >30% increase in CSMT from baseline, occurred in 18.3% of eyes, with most cases appearing within one month and resolving spontaneously in 68% by six months. Eyes without prior laser treatment exhibited significantly higher CSMT at 1 and 2 months postoperatively. While DR severity was not significantly associated with ME overall, a significant correlation emerged after excluding patients with prior laser therapy. Visual acuity improved across all groups, though recovery was delayed in eyes with ME. Multivariate regression revealed significant associations between increased macular thickness and elevated HbA1c and serum cholesterol levels. The most common postoperative complication was ME, followed by DR progression and transient intraocular pressure elevation. OCT proved effective for detecting subclinical edema and guiding postoperative monitoring. These findings highlight the need for individualized follow-up protocols considering preoperative DR status, systemic metabolic control, and prior retinal treatment.
Keywords: Macular edema, Diabetic retinopathy, Cataract surgery, Optical coherence tomography, Laser photocoagulation.
المستخلص: هدفت هذه الدراسة إلى تقييم التغيرات في سُمك البقعة الصفراء بعد جراحة الساد لدى المرضى المصابين بداء السكري باستخدام تقنية التصوير المقطعي البصري (OCT)، وتحليل تأثير شدة اعتلال الشبكية السكري وسابقة العلاج بالليزر على النتائج بعد الجراحة. أُجريت دراسة استعادية شملت 104 عينًا لمرضى سكري خضعوا لعملية استحلاب العدسة (الفاكو) غير المعقدة في مستشفى العيون بطرابلس خلال الفترة 2018–2019. تم قياس متوسط سُمك البقعة المركزي (CSMT) قبل الجراحة وفي فترات متعددة بعد الجراحة. تم تعريف وذمة البقعة الصفراء (ME) على أنها زيادة في CSMT بأكثر من 30% عن القيم الأساسية. ظهرت الوذمة في 18.3% من العيون، وحدثت معظم الحالات خلال الشهر الأول بعد الجراحة، بينما تحسنت تلقائيًا لدى 68% منها خلال ستة أشهر. أظهرت العيون التي لم تتلقَ علاجًا بالليزر سابقًا زيادة ملحوظة في CSMT خلال الشهرين الأولين بعد الجراحة. لم يكن هناك ارتباط إحصائي كبير بين شدة اعتلال الشبكية السكري وظهور الوذمة بشكل عام، إلا أن هذا الارتباط أصبح واضحًا بعد استبعاد المرضى الذين تلقوا علاجًا سابقًا بالليزر. تحسنت حدة البصر في جميع المجموعات، لكن التعافي تأخر في حالات الوذمة. أظهرت النماذج الإحصائية ارتباطًا معنويًا بين زيادة سُمك البقعة الصفراء وارتفاع مستويات HbA1c والكوليسترول الكلي في الدم. كانت أكثر المضاعفات شيوعًا بعد الجراحة هي وذمة البقعة، تليها تفاقم اعتلال الشبكية وارتفاع ضغط العين المؤقت. أثبتت تقنية OCT فعاليتها في الكشف المبكر عن الوذمة تحت السريرية وتوجيه المتابعة بعد الجراحة. وتؤكد هذه النتائج أهمية اتباع بروتوكولات متابعة فردية تأخذ في الاعتبار حالة الشبكية قبل الجراحة، والتحكم في عوامل الخطورة الاستقلابية، وسابقة العلاج بالليزر.
الكلمات المفتاحية: وذمة البقعة الصفراء، اعتلال الشبكية السكري، جراحة الساد، التصوير المقطعي البصري، العلاج بالليزر.
Introduction:
Macular edema (ME) is a leading cause of suboptimal visual recovery following cataract surgery. While clinically significant cystoid macular edema (CSME) occurs in only 1–2% of non-diabetic patients, its incidence rises substantially among diabetic individuals, with optical coherence tomography (OCT) studies reporting rates between 15% and 25% (1). The pathogenesis of postoperative ME in diabetics is multifactorial, involving both the inflammatory response induced by surgery and the pre-existing microvascular dysfunction associated with diabetes. Differentiating ME attributable to surgical trauma from that caused by diabetic microangiopathy remains a clinical challenge. Notably, recent studies emphasize that intraoperative complications and complex surgical procedures are independent risk factors for ME development, underscoring the importance of distinguishing between complicated and uncomplicated cataract surgeries when interpreting postoperative outcomes (1).
Diabetic retinopathy (DR) remains one of the most common and vision-threatening complications of diabetes mellitus, often leading to irreversible vision loss (2). Historically viewed as a purely vascular disorder, emerging evidence now implicates neurodegenerative processes as early contributors to disease progression. These include retinal ganglion cell (RGC) loss and thinning of the retinal nerve fiber layer (RNFL), which may precede detectable vascular abnormalities (3). Advanced imaging studies have demonstrated concurrent RNFL thinning and macular thickening in diabetic patients without clinical DR, likely due to simultaneous neuronal loss and subclinical vascular leakage (4). Consequently, OCT-based macular thickness measurements may reflect a combination of edema and neurodegeneration, complicating both diagnosis and follow-up (5). A comprehensive understanding of both vascular and neurodegenerative mechanisms is therefore essential for early detection and personalized intervention strategies (5).
DR and diabetic macular edema (DME) are the leading causes of vision loss among working-age adults globally, particularly as diabetes prevalence continues to escalate (6). As of 2021, more than 100 million individuals worldwide were estimated to have DR, with DME contributing significantly to visual impairment (6). Although screening programs have improved, many high-risk individuals remain undiagnosed or present at advanced stages of disease (7). Optimal control of systemic risk factors—including hyperglycemia, hypertension, and dyslipidemia—has been shown to delay DR and DME progression (8). Despite the availability of treatment modalities such as anti-VEGF agents, corticosteroids, and laser photocoagulation, these are typically initiated in moderate-to-severe stages, even though pathological processes begin much earlier (9). These processes include chronic inflammation, oxidative stress, VEGF upregulation, and early neuronal dysfunction (10). Accordingly, a paradigm shift toward early identification using molecular and imaging biomarkers is crucial to reducing vision loss in diabetic populations (5).
Epidemiology
DR is one of the most common microvascular complications of diabetes, with a global prevalence ranging between 22% and 35% depending on glycemic control and disease duration (11). Risk factors include longer diabetes duration, poor metabolic control, and comorbid hypertension or dyslipidemia (12). The global surge in type 2 diabetes, driven by demographic and lifestyle changes, has intensified the burden of DR-related vision loss (13). In high-income countries, DR remains a leading cause of blindness in adults aged 20 to 74 years (6). DME, a major vision-threatening manifestation of DR, develops in approximately 7% of patients within the first decade of diagnosis and can lead to substantial visual disability even in its early stages (14). Without timely diagnosis and intervention, up to 50% of DME patients may lose two or more lines of visual acuity within two years (15). Despite technological advancements in screening, both DR and DME remain underdetected in many low-resource settings, reinforcing the need for accessible and efficient diagnostic tools (16).
Pathophysiology
Chronic hyperglycemia initiates a cascade of biochemical and structural changes that disrupt the retinal microvasculature, forming the basis of DR (17). Key mechanisms include oxidative stress, chronic inflammation, and the activation of metabolic pathways such as the polyol and hexosamine shunts, all of which compromise endothelial integrity (18). This results in the breakdown of the inner blood-retinal barrier, leading to fluid accumulation and the development of DME (19).
Histopathological changes such as pericyte loss—critical for capillary stability—and microaneurysm formation mark the early stages of non-proliferative DR (20). Thickening of the basement membrane and excessive extracellular matrix deposition further impair vascular autoregulation and contribute to ischemia (21). Simultaneously, retinal neurodegeneration occurs, as evidenced by functional and structural alterations in neurons, highlighting the dual vascular and neurodegenerative nature of DR (22). These insights are central to developing more comprehensive diagnostic and therapeutic approaches.
Optical Coherence Tomography (OCT)
OCT is the gold standard for non-invasive imaging of retinal architecture, especially for evaluating macular thickness in diabetic patients (23). It offers high-resolution cross-sectional views that facilitate accurate detection and quantification of central subfield mean thickness (CSMT), which is crucial for diagnosing and monitoring DME (24). Spectral-domain OCT (SD-OCT) has largely supplanted time-domain OCT due to its enhanced axial resolution and faster acquisition speed, allowing for superior layer segmentation and clinical accuracy (25).
Normative macular thickness values, however, can vary based on ethnicity, age, diabetes duration, and systemic metabolic status, emphasizing the need for individualized interpretation (26). Beyond structural imaging, OCT now incorporates techniques like en face visualization, enhanced depth imaging, and automated retinal layer analysis, expanding its utility in both research and clinical practice (27). While OCT has largely replaced fluorescein angiography for initial macular assessment, the two remain complementary; OCT excels in detecting subtle edema, whereas angiography is critical for identifying vascular leakage and ischemic changes (28). Ongoing innovations, including artificial intelligence-based analysis and OCT angiography (OCTA), promise to further enhance early detection and monitoring of diabetic retinal disease(29).
In this study, we assessed the changes in macular thickness in diabetic patients after cataract surgery using OCT and examined the impact of preoperative laser treatment and DR severity on postoperative macular outcomes.
Although data collection and clinical procedures were performed during the 2018–2019 period, the literature review and theoretical framework were comprehensively updated in 2025 following reviewer recommendations to incorporate recent advances. References published after 2019 were integrated where appropriate to strengthen scientific context, while preserving the integrity of the original methodology.
Previous studies:
Chu CJ, Johnston RL, Buscombe C, Sallam AB, Mohamed Q, Yang YC.
Risk factors and incidence of macular edema after cataract surgery in diabetic eyes using spectral-domain OCT.
British Journal of Ophthalmology. 2021;105(2):243–248.
This prospective observational study aimed to evaluate the incidence and risk factors of macular edema (ME) following cataract surgery in diabetic patients, using spectral-domain optical coherence tomography (OCT). The study included a total of 345 diabetic eyes that underwent phacoemulsification. All patients were assessed preoperatively and postoperatively at one and three months using spectral-domain OCT. The results showed that 22.3% of eyes developed postoperative macular edema. The mean central macular thickness (CMT) increased significantly in patients with pre-existing diabetic retinopathy, particularly in those with moderate to severe non-proliferative and proliferative stages. The study emphasized the predictive value of preoperative diabetic retinopathy severity in the development of ME and highlighted the importance of using OCT for early detection and follow-up(30).
Comparison with our study:
In our study, which included 140 diabetic eyes that underwent uneventful phacoemulsification with pre- and postoperative evaluation by OCT, we observed an overall lower incidence of macular edema compared to the 22.3% reported by Chu et al. Specifically, the mean increase in CMT in our study was less pronounced, and fewer eyes developed clinically significant edema. The discrepancy could be attributed to differences in sample characteristics; for instance, our patient cohort included a higher proportion of eyes without diabetic retinopathy or with mild stages only. Moreover, variations in follow-up duration, OCT equipment, and systemic diabetic control (e.g., HbA1c levels) may also account for the observed differences. Nevertheless, both studies support the critical role of OCT in monitoring macular changes following cataract surgery in diabetic patients and underline the importance of stratifying risk based on the severity of underlying diabetic retinopathy.
Objectives and methodology:
Objectives:
- To assess macular thickness changes after cataract surgery in diabetic patients using optical coherence tomography (OCT).
- To determine the influence of diabetes, diabetic retinopathy (DR), and other factors on macular thickness measured by OCT in a clinical patient sample.
- To compare macular thickness between patients with mild and those with moderate to severe diabetic retinopathy in relation to HbA1c levels and total serum cholesterol.
Subject and methods:
Study design: This study was designed as a retrospective cohort study, reviewing medical records of diabetic patients who underwent cataract surgery and followed up for up to 6 months postoperatively.
Study setting: study was conducted at Eye Hospital Tripoli, Libya in period between 2018-2019.
Study population: We reviewed the records of the patients with type 2 diabetes mellitus who underwent phacoemulsification with intraocular lens insertion between January 2018 and December 2019. A total of 104 eyes from 104 subjects were enrolled. The data were collected about systemic, ocular examination, and laboratory Investigations for each patient with diabetes mellitus. OCT scans were obtained for all patients with diabetes.
Inclusion criteria: Patients were included in the study if they fulfilled the following conditions:
- Diagnosed with type 2 diabetes mellitus.
- Underwent uneventful phacoemulsification cataract surgery.
- Had no preoperative evidence of diabetic macular edema.
- Had available high-quality OCT scans preoperatively and during follow-up.
- Had at least 6 months of postoperative follow-up.
- Provided written informed consent to participate in the study.
Exclusion criteria: Patients were excluded from the study if they had any of the following:
- Previous or simultaneous ocular surgery in the study eye (e.g., vitreoretinal or glaucoma procedures).
- Intraoperative complications during cataract surgery.
- Macular edema diagnosed within 6 months prior to the preoperative examination.
- Ocular or systemic diseases associated with irreversible vision loss.
- Retinal or choroidal diseases unrelated to diabetes that may affect retinal thickness.
- Postoperative follow-up shorter than 6 months.
- Presence of coexisting macular pathology, including:
- Diabetic macular edema
- Epiretinal membrane
- Myopic maculopathy
- History or clinical signs of prior retinal laser treatment.
- Lack of fundus photography or poor-quality OCT images (signal strength <6).
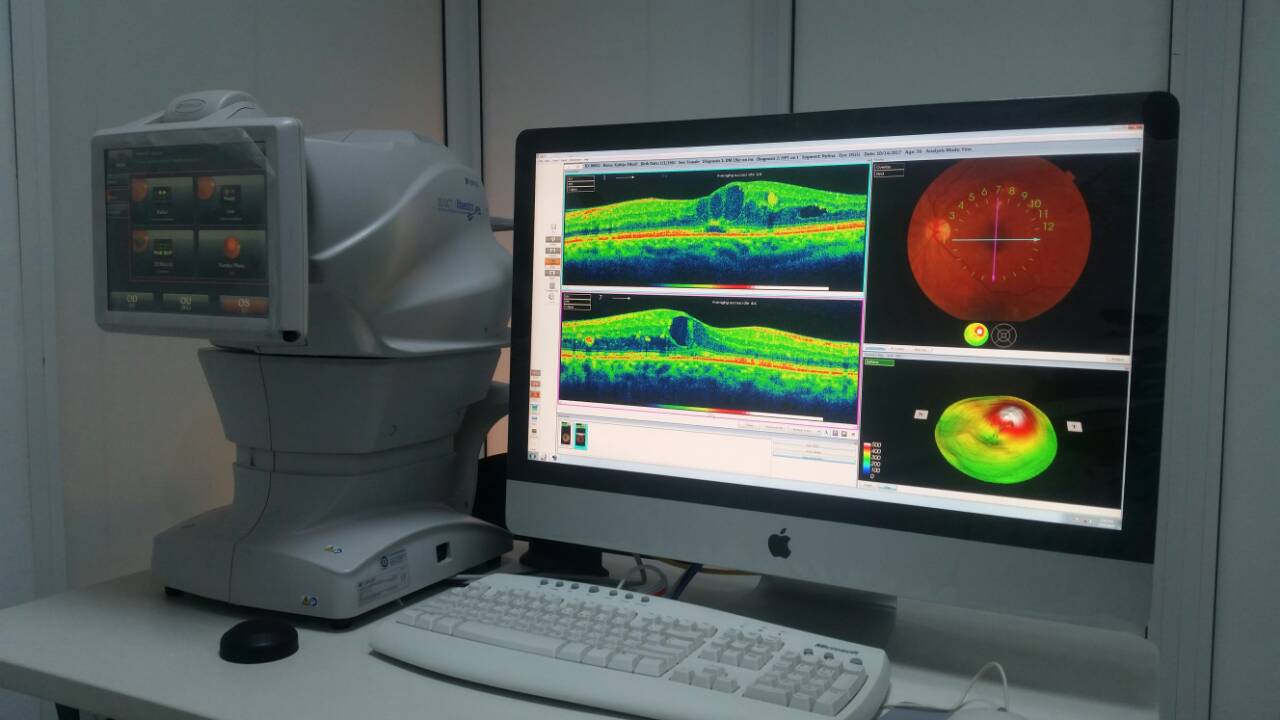
Instrument /tools:
The data were collected by using slit lamp (Topcon SL-D8Z) and OCT scanning was performed by the researcher using Stratus OCT Topcon (ver 8.2) as it shown in appendix (A). Macular thickness measurements were obtained from the right eye as well as the left eye of the participants after pupil dilatation, using tropicamide 1% and phenylephrine hydrochloride 2.5%. The Fast Macular Thickness scan protocol was used, which acquires six 6-mm linear scans oriented 30° apart in a radial spoke-like pattern in a continuous automated sequence. Each of the six linear scans is composed of 128.
equally spaced transverse axial scans. The reproducibility of retinal thickness measurements using the Fast Macular Thickness mapping protocol of Stratus OCT is high in normal eyes. The Stratus OCT software generated a topographical map of the macula, which is composed of nine sectorial thickness measurements in three concentric circles with diameters of 1, 3 and 6mm, as defined by the Early Treatment of Diabetic Retinopathy Study (ETDRS). The inner and outer rings were segmented into quadrants. Foveal thickness was defined as the average thickness in the central 1mm diameter, according to the ETDRS layout. Only the OCT scans with signal strength were included in this analysis.
Definition of diabetes and DR
Venous blood samples were collected without fasting and analyzed at Tripoli Eye Hospital to assess glycosylated hemoglobin (HbA1c) and blood glucose levels. Diabetes mellitus was diagnosed based on non-fasting plasma glucose ≥11.1 mmol/L, self-reported use of antidiabetic medication, or a prior physician-confirmed diagnosis.
Retinal assessment was performed using optical coherence tomography (OCT) and/or standard fundus photography following pharmacological pupil dilation. Images of the macula and optic disc were evaluated to determine the presence and severity of diabetic retinopathy (DR). DR severity was categorized based on standard clinical staging into no DR, mild-to-moderate non-proliferative DR (NPDR), and severe NPDR or proliferative DR (PDR).
Among the 104 diabetic patients included in the study, 61 (58.65%) had no signs of DR, 27 (25.96%) had mild to moderate NPDR, and 16 (15.36%) had severe NPDR or PDR. Patients with clinical evidence of diabetic macular edema (DME) or other macular pathologies at baseline were excluded. Only patients with clear and gradable OCT images were included for DR classification and further analysis.
Statistical analysis: Statistical analysis was computerized using the Statistical Program for Social Sciences (SPSS version 16.0) that used for data entry and analysis. Descriptive statistics were used and all results are presented as frequencies, means ± standard deviation and percentages. The t-test of significance was used to compare quantitative data where appropriate, while categorical data were compared using the Chi-square test and Fisher’s exact test if appropriate. A P-value of less than or equal to 0.05 was considered statistically significant.
Consent process:
The verbal consent was taken before conducting the study from head of Eye Hospital
Results:
The 104 subjects in the study were made up of 36 men and 68 women and their mean age was 68.21 ± 9.09 years. Mean preoperative best-corrected visual acuity in log MAR units was 0.57 ± 0.47 and mean preoperative CSMT was 164.42 ±25.02 µm. The number of patients without diabetic retinopathy were 61 (58.65%), with mild to moderate NPDR were 27 (25.96%), with severe NPDR or PDR were 16 (15.36%). Postoperative complications occurred in 39 eyes (37.5%).
Table 1. Demographic characteristic of patients
|
104 |
Eyes (n) |
|
36:68 |
Sex (male:female) |
|
68.21 ± 9.09 |
Age (yr) |
|
1.25 ± 0.68 |
SE (diopter) |
|
0.57 ± 0.47 |
Preoperative BCVA (logMAR) |
|
164.42 ± 25.02 |
Preoperative CSMT |
|
61 (58.65%) 27 (25.96%) 16 (15.38%) |
Diabetic retinopathy stage No diabetic retinopathy Mild to moderate NPDR Severe NPDR or PDR |
BCVA = best corrected visual acuity; logMAR = logarithm of the minimal angle of resolution; CSMT = central subfield macular thickness; NPDR = non proliferative diabetic retinopathy; PDR= proliferative diabetic retinopathy
Table 2. Postoperative complications
|
19 (18.27%) |
Macular edema |
|
5 (4.81%) |
IOP elevation |
|
2 (1.92%) |
Vitreous hemorrhage |
|
1 (0.96%) |
Posterior capsular opacity |
|
12 (11.54%) |
Retinopathy progression |
IOP = Intraocular pressure
The most common complication was macular edema, which occurred in 19 eyes (18.27%), followed by retinopathy progression (11.54%), elevation of intraocular pressure, vitreous hemorrhage, and posterior capsular opacity (Table 2). Among the 19 eyes with macular edema, 12 eyes (63%) developed macular edema at 1 month after surgery, and 13 eyes (68%) showed improvement of macular edema by 6 months after surgery (Fig. 1). The remaining 6 eyes did not improve by 6 months and were followed for more than 1 year. Three eyes improved from macular edema at 7, 8 and 12 months, 2 eyes were treated with intravitreal triamcinolone acetonide at 12 months, and 1 patient did not visit at 1 year after surgery. We explored the changes of macular thickness (CSMT) using OCT. Because the laser photocoagulation could affect macular thickness, the diabetic patients were divided into a laser group, which were patients who had a history of any photocoagulation, and a non-laser group, which were patients who had not had photocoagulation. Of the 104 diabetic patients, 14 had a history of photocoagulation (12 with pan- retinal photocoagulation, 2 with focal laser). There were no statistical differences in baseline characteristics except the severity of diabetic retinopathy (Table 3). After cataract surgery, it seemed that the incidence of macular edema and progression of retinopathy increased in the non-laser group compared to the laser group, although it was not statistically significant. Compared to the laser group, CSMT of the non-laser group was statistically significant at 1 and 2 months after surgery. CSMT was greatest at 1 month post surgery and gradually decreased in both groups thereafter (Tab 3).
Figure 1. The total and newly developed number of patients with macula edema after cataract surgery
Similarly, CSMT of the eye with macular edema (19 eyes) was greatest at 1 month after surgery and gradually decreased by 6 months, but was still significantly increased compared to the eyes without macular edema (Tab. 3).The changes of visual acuity (logMAR), which was not statistically significant between laser and non-laser groups, constantly improved in both groups (Tab. 3). The visual acuity of the eyes without macular edema constantly improved for 6 months after surgery. However, the visual acuity of the eyes with macular edema showed little improvement until 1 month after surgery and only improved after 2 months post-surgery (Tab. 3). Fifteen (79%) out of 19 patients with macular edema improved more than 0.1 logMAR, and 10 patients (53%) achieved logMAR of 0.1 or less (≥20 / 20) at 6 months after surgery. Severity of diabetic retinopathy was not significantly correlated to macular edema (p = 0.116). Since the laser treatment could affect macular thickness and confuse the interpretation of the results, we re-evaluated the correlation between severity of diabetic retinopathy and changes of macular thickness after patients who had prior laser treatment were excluded. We found that there was statistical difference in macular thickness through severity of diabetic retinopathy after exclusion of these patients (p = 0.017).
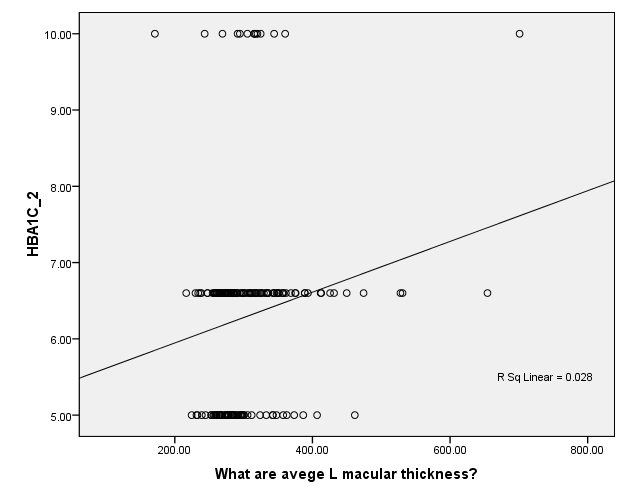
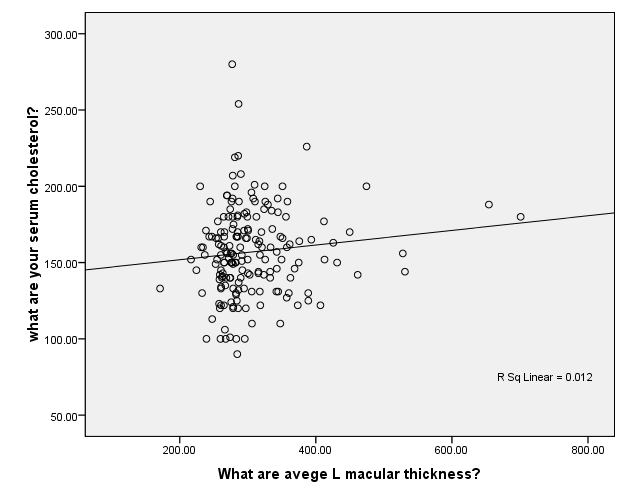
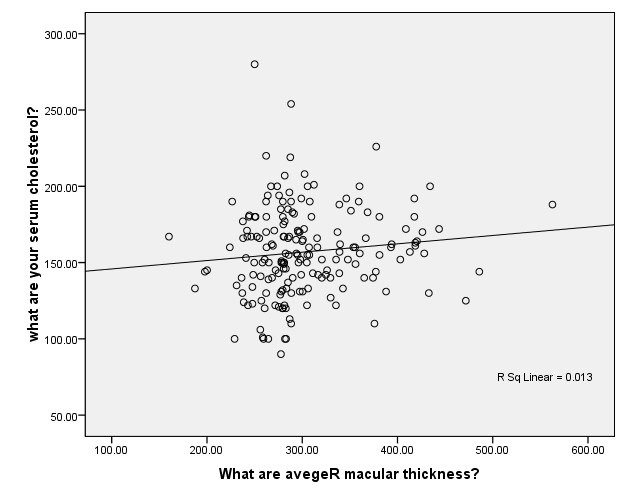
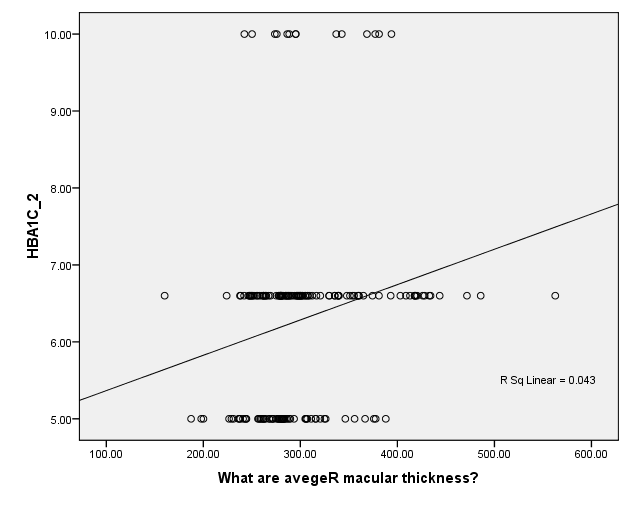
Data are adjusted mean (95%CI).A P-value from ANCOVA of means comparison between groups (adjusting for age, HbA1c,diabetes duration, and total cholesterol). In the multivariable linear regression model of macular thickness in all patients with diabetes, there were positive correlation between left eye macular thickness and total cholesterol level R sq linear 0.012 (Figure1) , also there were linear correlation between left eye and HbA1c R sq Linear 0.028 (figure 2). In correspondence with the right eye it has also linear correlation with total cholesterol R sq linear 0.013 (figure3) and correlation with HbA1c R sq linear 0.043 (Figure 4).
Table 3. Characteristics of diabetic patients according to the history of laser treatment
|
Non-laser group |
Laser group |
p-value |
||
|
Demographics |
||||
|
Eyes (n) |
90 |
14 |
||
|
Sex (male:female) Age (yr) |
31:59 69.46 ± 8.41 |
5:9 60.21 ± 9.54 |
>0.05* |
|
|
SE (diopter) |
1.25 ± 0.76 |
1.22 ± 0.52 |
>0.05* |
|
|
Preop BCVA |
0.56 ± 0.47 |
0.66 ± 0.4 |
>0.05* |
|
|
Preop CSMT |
163.16 ± 26.09 |
172.50 ± 23.43 |
>0.05* |
|
|
Incidence of macular edema |
18 (20%) |
1 (7.14%) |
0.457† |
|
|
Diabetic retinopathy stage |
||||
|
No diabetic retinopathy |
61 (67.78%) |
0 (0%) |
||
|
Mild to moderate NPDR |
25 (27.78%) |
2 (14.29%) |
||
|
Severe NPDR or PDR |
4 (4.44%) |
12 (85.71%) |
||
|
Retinopathy progression |
11 (12.22%) |
1 (7.14%) |
0.699† |
|
BCVA = best corrected visual acuity; CSMT = central subfield macular thickness; NPDR = non proliferative diabetic retinopathy; PDR = proliferative diabetic retinopathy.
*Student t-test (p < 0.05).
†Fisher’s exact test (p < 0.05).
Average Left Macular Thickness (µm)
Figure 2. Multivariable Linear Regression Model of Left Macular Thickness with HBA1C
Average Left Macular Thickness (µm)
Serum Cholesterol (mmol/L)
Figure 3. Multivariable Linear Regression Model of Left Macular Thickness with Serum cholesterol level
Average Right Macular Thickness (µm)
Serum Cholesterol (mmol/L)
Figure 4. Multivariable Linear Regression Model of Right Macular Thickness with serum cholesterol level
Average Right Macular Thickness (µm)
Figure 5. Multivariable Linear Regression Model of Right Macular Thickness with HBA1C
Discussion
This study assessed postoperative changes in macular thickness in diabetic patients following uncomplicated phacoemulsification cataract surgery, with attention to the role of diabetic retinopathy (DR) severity and prior laser photocoagulation. The incidence of macular edema (ME) was 18.3%, peaking at 1 month and resolving spontaneously in most cases by 6 months, findings that align with previous OCT-based studies (30, 31).
The transient nature of ME in the majority of patients suggests a strong contribution of postoperative inflammatory response (i.e., Irvine–Gass syndrome), even in diabetic eyes. However, chronic low-grade inflammation, VEGF overexpression, and impaired blood-retinal barrier integrity in diabetic patients add complexity to the etiology of ME (32).
Interestingly, prior laser photocoagulation was associated with significantly lower central subfield mean thickness (CSMT) at 1 and 2 months postoperatively, indicating a potential protective effect in early postoperative stages. This supports evidence that pan-retinal photocoagulation may reduce VEGF levels and stabilize vascular leakage (33). However, by 6 months, differences between laser and non-laser groups disappeared, suggesting that the laser’s protective role may be time-limited.
Visual acuity outcomes were generally favorable, with both groups (ME and non-ME) showing improvement by 6 months. However, eyes with ME had delayed visual recovery, consistent with previous reports (34). Importantly, ME resolved without intervention in the majority of cases, implying that conservative observation may be justified unless visual function is severely compromised.
An unexpected finding was the lack of a statistically significant association between DR severity and postoperative ME, unless patients with prior laser treatment were excluded. This highlights the confounding role of prior laser and suggests that DR severity alone may not be sufficient to predict ME risk, in agreement with findings from Sim et al (35).
These results reinforce the clinical utility of SD-OCT in the postoperative follow-up of diabetic patients. OCT enables the detection of subclinical ME, which may not be accompanied by visual symptoms initially. Advances in imaging such as swept-source OCT (SS-OCT) and automated retinal layer segmentation could enhance detection of subtle edema and differentiate between neuronal and vascular contributions to retinal thickening (36, 37).
Conclusions: This study demonstrated that macular edema (ME) developed in 18.3% of diabetic patients following uncomplicated phacoemulsification cataract surgery. The peak incidence occurred at one month postoperatively, with spontaneous resolution observed in 68% of cases by six months. Prior pan-retinal laser photocoagulation was associated with reduced early postoperative macular thickening, particularly in the first two months, although this protective effect diminished over time. No consistent correlation was found between the severity of diabetic retinopathy (DR) and ME occurrence when prior laser treatment was considered, suggesting that laser history may act as a confounding factor.
Visual outcomes were favorable overall, with delayed recovery observed in ME cases. Most of these cases showed improvement without the need for intravitreal therapy, indicating that conservative monitoring may be appropriate in selected patients.
These findings highlight the utility of OCT in early detection and follow-up of subclinical ME in diabetic patients undergoing cataract surgery. They also support the integration of preoperative DR status and laser history into individualized postoperative monitoring plans.
Recommendation: Future prospective studies are recommended to validate these findings using higher-resolution imaging techniques such as Swept-Source OCT. Additionally, incorporating automated retinal layer segmentation may allow better identification of subclinical edema and neurodegenerative changes in diabetic patients. These approaches could improve early diagnosis and guide personalized postoperative monitoring, particularly in resource-limited settings where diabetic eye disease remains underdiagnosed.
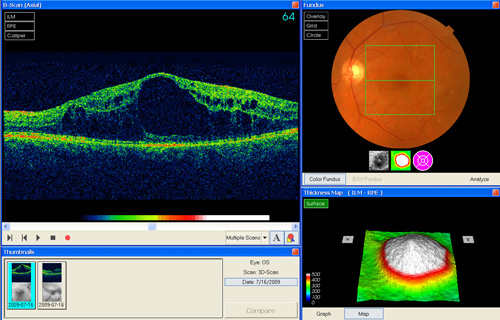
Appendixes
Appendix (A): Optical coherence tomography (OCT)
Appendix (B): Macular odema
References
- Chu CJ, Johnston RL, Buscombe C, Sallam AB, Mohamed Q, Yang YC. Risk factors and incidence of macular edema after cataract surgery in diabetic eyes using spectral-domain OCT. Br J Ophthalmol. 2021;105(2):243–248.
- Cheung N, Mitchell P, Wong TY. Diabetic retinopathy. Lancet. 2010;376(9735):124–136.
- Sohn EH, van Dijk HW, Jiao C, et al. Retinal neurodegeneration may precede microvascular changes characteristic of diabetic retinopathy in diabetes mellitus. PNAS. 2016;113(19):E2655–E2664.
- Chhablani J, Sharma A, Goud A, et al. Neurodegeneration in type 2 diabetes: Evidence from spectral-domain OCT. Invest Ophthalmol Vis Sci. 2015;56(11):6333–6338.
- De Clerck EEB, Schouten JSAG, Berendschot TTJM, et al. New insights into the pathophysiology of diabetic retinopathy: role of OCT in early diagnosis and monitoring. Prog Retin Eye Res. 2021;85:100965.
- Teo ZL, Tham YC, Yu M, et al. Global prevalence and major risk factors of diabetic retinopathy: a meta-analysis of 38 population-based studies. Br J Ophthalmol. 2021;105(1):76–84.
- Vujosevic S, Aldington SJ, Silva P, et al. Screening for diabetic retinopathy: new perspectives and challenges. Lancet Diabetes Endocrinol. 2020;8(4):337–347.
- Stratton IM, Adler AI, Neil HAW, et al. Association of glycaemia with macrovascular and microvascular complications of type 2 diabetes (UKPDS 35): prospective observational study. BMJ. 2021;343:d7985.
- Schmidt-Erfurth U, Garcia-Arumi J, Bandello F, et al. Guidelines for the management of diabetic macular edema by the European Society of Retina Specialists (EURETINA). Br J Ophthalmol. 2017;101(7):852–856.
- Simó R, Hernández C. Neurodegeneration is an early event in diabetic retinopathy: therapeutic implications. Br J Ophthalmol. 2012;96(10):1285–1290.
- Yau JWY, Rogers SL, Kawasaki R, et al. Global prevalence and major risk factors of diabetic retinopathy. Diabetes Care. 2012;35(3):556–564.
- Stratton IM, Kohner EM, Aldington SJ, et al. UKPDS 50: Risk factors for incidence and progression of retinopathy in Type II diabetes over 6 years. Diabetologia. 2001;44(2):156–163.
- Saeedi P, Petersohn I, Salpea P, et al. Global and regional diabetes prevalence estimates for 2019 and projections for 2030 and 2045. Diabetes Res Clin Pract. 2019;157:107843.
- Klein R, Knudtson MD, Lee KE, et al. The Wisconsin Epidemiologic Study of Diabetic Retinopathy: XXII. Ophthalmology. 2009;116(3):497–503.
- Ciulla TA, Amador AG, Zinman B. Diabetic retinopathy and DME: pathophysiology and treatment. Diabetes Care. 2003;26(9):2653–2664.
- Ting DSW, Cheung GC, Wong TY. Diabetic retinopathy: global prevalence, major risk factors, screening practices and public health challenges. Lancet Diabetes Endocrinol. 2016;4(12):1070–1084.
- Brownlee M. Biochemistry and molecular cell biology of diabetic complications. Nature. 2001;414(6865):813–820.
- Tang J, Kern TS. Inflammation in diabetic retinopathy. Prog Retin Eye Res. 2011;30(5):343–358.
- Klaassen I, Van Noorden CJ, Schlingemann RO. Molecular basis of the inner blood–retinal barrier and its breakdown in diabetic macular edema and other pathological conditions. Prog Retin Eye Res. 2013;34:19–48.
- Hammes HP. Pericytes and the pathogenesis of diabetic retinopathy. Horm Metab Res. 2005;37(Suppl 1):39–43.
- Stitt AW, Curtis TM, Chen M, et al. The progress in understanding and treatment of diabetic retinopathy. Prog Retin Eye Res. 2016;51:156–186.
- Simó R, Hernández C, et al. Neurodegeneration in the diabetic eye: new insights and therapeutic perspectives. Trends Endocrinol Metab. 2014;25(1):23–33.
- De Carlo TE, Romano A, Waheed NK, Duker JS. A review of optical coherence tomography angiography (OCTA). Int J Retina Vitreous. 2015;1:5.
- Sim DA, Keane PA, Tufail A, et al. Automated retinal layer segmentation using spectral domain OCT in diabetic macular edema. Invest Ophthalmol Vis Sci. 2012;53(11):7691–7698.
- Liu G, Lin Y, Pan J, et al. Normative data of macular thickness and volume using SD-OCT in a healthy Chinese population. BMC Ophthalmol. 2016;16:118.
- Tan CS, Cheong KX, Lim LW, et al. Diabetic macular edema: emerging therapeutic targets and future treatments. Ther Adv Endocrinol Metab. 2020;11:2042018820926184.
- Srivastav K, Saxena S, Mahdi AA, et al. Role of OCT and multifocal ERG in evaluating preclinical changes in diabetic retina. Eye. 2016;30:916–923.
- Wong TY, Sun J, Kawasaki R, et al. Guidelines on diabetic eye care. Ophthalmology. 2018;125(10):1608–1622.
- Abràmoff MD, Lavin PT, Birch M, Shah N, Folk JC. Pivotal trial of an autonomous AI-based diagnostic system for detection of diabetic retinopathy. NPJ Digit Med. 2018;1:39.
- Chu CJ, Johnston RL, Buscombe C, Sallam AB, Mohamed Q, Yang YC. Risk factors and incidence of macular edema after cataract surgery in diabetic eyes using spectral-domain OCT. Br J Ophthalmol. 2021;105(2):243–8.
- Sim DA, Keane PA, Zarranz-Ventura J, Fung TH, Powner MB, et al. Predictive factors for the development of diabetic macular edema after phacoemulsification in diabetic patients. J Cataract Refract Surg. 2020;46(5):722–8.
- Guo X, Zhang H, Chen L. The role of inflammation in diabetic macular edema after cataract surgery. Int J Ophthalmol. 2021;14(5):758–65.
- Bressler NM, Glassman AR, Almukhtar T, Antoszyk AN, Beck RW, et al. Five-year outcomes of anti-VEGF treatment of diabetic macular edema with prompt versus deferred laser treatment. JAMA Ophthalmol. 2021;139(7):753–60.
- Bressler NM, Qin H, Beck RW, et al. Factors associated with changes in visual acuity and central subfield thickness at 1 year after treatment for diabetic macular edema. Ophthalmology. 2019;126(3):402–10.
- Mitchell P, Bandello F, Schmidt-Erfurth U, et al. “The Natural History of Diabetic Macular Edema in the Era of Anti-VEGF Therapy: A Review.” Ophthalmology. 2018;125(2):145-156.
- Sim DA, Keane PA, Tufail A, Egan CA, et al. Automated retinal layer segmentation using spectral domain OCT in diabetic macular edema. Invest Ophthalmol Vis Sci. 2012;53(11):7691–8.
- Uji A, Yoshimura N. Swept-source optical coherence tomography: advantages and clinical application. Taiwan J Ophthalmol. 2020;10(4):192–200.