
Determining the Level of Commonly Used Pesticides in water at Different Ecosystems in Sudan - Case study: (Kassala- al-Gadarif State)
Wallaaldeen Ibraheem Abdalfadeel1a*, Salah Mergani Motwakil2b, Hana Abdelaziz3c
a*wallaaldeen7@gmail.com, b salahmergany@gmail.com, c hanaaziz55@hotmail.com
1Kassala University, Faculty of Sciences, Sudan
2, 3 Red Sea University, Faculty of applied Sciences, Sudan
*Corresponding author Email
DOI: https://doi.org/10.53796/hnsj65/13
Arabic Scientific Research Identifier: https://arsri.org/10000/65/13
Volume (6) Issue (5). Pages: 146 - 156
Received at: 2025-04-07 | Accepted at: 2025-04-15 | Published at: 2025-05-01
Abstract: The Pesticide residues in the environment pose a risk to public health and environmental components, especially water, particularly in agricultural areas that rely on the intensive use of pesticides. Analytical chemistry has played a significant role in Using analytical methods and laboratory equipment to estimate these residues. In This study aims to evaluate the levels of pesticide residues in some agricultural areas at the case study by collecting (10) water samples. The study relied on the use of gas chromatography and the presentation of results and statistical analysis using the statistical program (SPSS). as the results of the analyses of water samples showed that terbufos, parathion, and profenofos topped the list with average concentrations of (0.462), (0.333), and (0.289) mg/kg, respectively. In water samples, the study showed that terbufos, parathion, and profenofos were the most concentrated (0.357), (0.188), (0.187) mg/L, respectively. Through the results of the (T) test for the samples, the pesticide concentrations showed a significant difference (P<0.05) in their mean with the specified value (0.001), where a strong correlation was shown between the use of these pesticides and their concentrations in the samples.
Keywords: Pesticides, water, ecosystems.
.
Introduction:
The pollution of soils and water resources by pesticides, detergents, solvents and a variety of industrial organic chemicals is a pressing worldwide problem [1].The word pesticide literally means an agent used to kill an undesirable organism. Specifically Pesticides in the third world have been used in agriculture to increase productivity, quality and quantity of food, and fiber; in industry, in commerce and municipal for rodent and weed control; in medical and health sector, for vector control of mosquitoes, other vector of diseases and urban environment for pest control. All these Pesticides can be polluting the soil and water [2]
There are many ways in which pesticides can reach water:(Miles, 1968) They may be directly applied as aerial sprays or granules to control water in habituating pests, They may fall onto the surface of water, when agricultural land is sprayed from the air, Spray drift from normal agricultural practices, Residues may reach water as surface runoff from treated soil, Insecticides may be discharged into rivers through factory or sewage effluents; industrial and domestic discharge, and Recycling of domestic residues by falling rain or dust[3] [4].
In this study aimed to aims to determine and evaluate the levels of pesticide residues (terbufos, parathion, and profenofos) in some agricultural areas of Kassala and Gedaref state in eastern Sudan, by utilized of gas chromatography test and the statistical program (SPSS).
Materials and Methods
Collection of water Samples:
AL-Gadarif state:-
Seven samples of water (1.5 liter each) taken up to 30 cm deep were collected from different locations of AL- Gadarif state. The samples were collected from different scours. Collected samples were transferred to sample bottles (P.V.C. bottles of 1.5 liter capacity) using a glass funnel (250ml). The sample bottles were covered by screw caps from the same materials (P.V.C), sealed with Teflon tape, labeled with date and sample number and taken immediately to the laboratory of the Institute of Environmental Studies, University of Khartoum. Collected samples were stored at room temperature (at 30°C) until analyzed [5]
Kassala state:-
Four samples of water (1.5 liter each) taken up to 30 cm deep were collected from different locations of Kassala state. The samples were collected from different scours. Collected samples were transferred to sample bottles (P.V.C. bottles of 1.5 liter capacity) using a glass funnel (250ml). The sample bottles were covered by screw caps from the same materials (P.V.C.) sealed with Teflon tape, labeled with date and sample number and taken immediately to the laboratory of the Institute of Environmental and food pollutant Studies, faculty of agriculture, Fayoum University, Egypt[5].
Extraction and Clean-up
Extraction of water Samples
Extracts from each sample were transformed into a 500 ml separator funnel. 400 ml of n-hexane and 100 ml of acetone were added .The jar were tightly closed and placed on an end over –end shaker for two hours .they were left to stand for a while and then filtered through 240-mm filter paper into around bottom flask containing 100 g anhydrous sodium sulfate to absorb the moisture. Extracts were then Flittered, and solvent was stripped off. The solvent was removed to dryness by rotary evaporator operating under vacuum at a temperature of 40°C. Dried extracts were reconstituted in 10 ml hexane and kept in closed vials at 4°C for clean-up and residues analysis. Two drops of KOH were added to each vial to convert DDT (Dicholoro-Diphenyl-Trichloroethane) to DDE (Dicholoro-Diphenyl-Ethylene) prior to the analysis [6]. Clean-up of water Samples
Clean–up was done according to the method of (Winklemam. and Harmburg., 1980). A chromatographic column (20 x 40mm) was plugged from its lower end with glass wool and then about 4 inches of activated silica gel and layer of anhydrous sodium sulphate were added. The column was first rinsed with few ml of hexane. Extracts from each sample were added as soon as the hexane dried in the top of the silica gel layer and eluted with 200 ml of toluene: acetone (19:1) mixture. The elates were concentrated to dryness by rotary evaporation, reconstituted in 10 ml of acetone, transferred to 10 ml volumetric flask and stored at 4°C for subsequent residues analysis[7].
Gas Liquid Chromatographic (GLC) Analysis
Pesticides in the samples were determined by Hewlett Packard Model 6890 Gas Liquid Chromatography (GLC) equipped with Ni63 electron capture detector (ECD) and DB-5 MS capillary column with 30 m length × 0.25 mm internal diameter0.25mm ID. The Stationary phase was composed of an inner coating of 0.25 µm film of five percent pleusl methyl poly siloxane) (8). The column temperature was programmed at an initial oven temperature of 180◦C for 2 min., raised at 3◦C/min to 220 ◦C, finally held at 220 ◦C for 1 min and then raised at 9◦C / min to 280 ◦C where it was held for 7 minutes. Injector and detector temperatures were 280◦C and 300◦C respectively. Nitrogen was used as carrier gas at a flow rate of 4 ml/min [8] [9].
Data analysis:
The Statistical Package for Social Sciences (SPSS), version 16.0 (SPSS Inc., Chicago, USA) was used for data analyses. Results are presented as frequencies, percentage, Mean ± SD and regression coefficient. The student’s t-test was used to compare mean levels between groups. Chi-esquire was used for qualitative data. P-value ≤0.05 was considered as the statistical significance [10].
Results and discussion
The Result of the distribution of pesticide Carboxin concentrations in the (10) water samples, as shown in Figure (1). The consistency between the percentage and corrected percentage indicates the absence of missing concentrations. The high frequency of the value (0.093ml/L) suggests that it is the most prevalent in the (10) water samples.
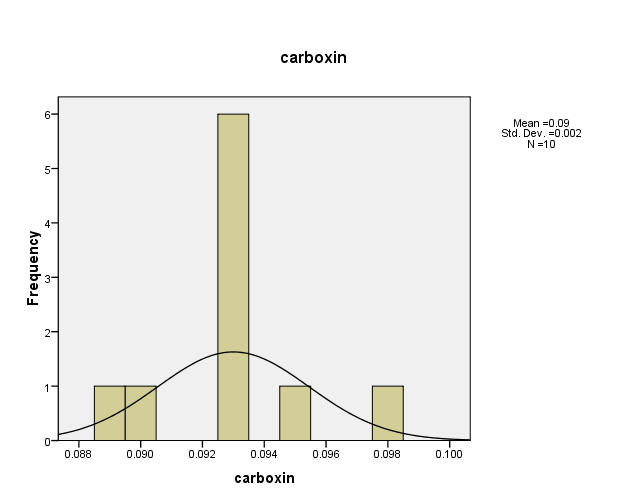
Figure (1): The distribution of concentrations (mg/L) and percentages of (Carboxin) in the soil samples, prepared by the researcher.
- Distribution of pesticide Chloropyrifos concentrations in the (10) water samples, as shown in Figure (2).The consistency between the percentage and corrected percentage indicates the absence of missing concentrations. The high frequency of the value (0.06 ml/L) suggests that it is the most prevalent in the (10) water samples.
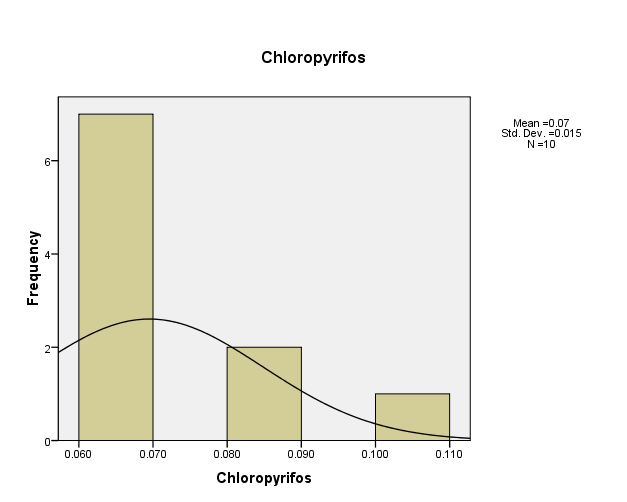
Figure (2) shows the distribution of concentrations (mg/L) and percentages of (Chloropyrifos) in the soil samples, prepared by the researcher.
- Figure (3) showed that the distribution of pesticide Clorfenapir concentrations in the (10) water samples. The consistency between the percentage and corrected percentage indicates the absence of missing concentrations. The high frequency of the value (0.054ml/L) suggests that it is the most prevalent in the (10) water samples.
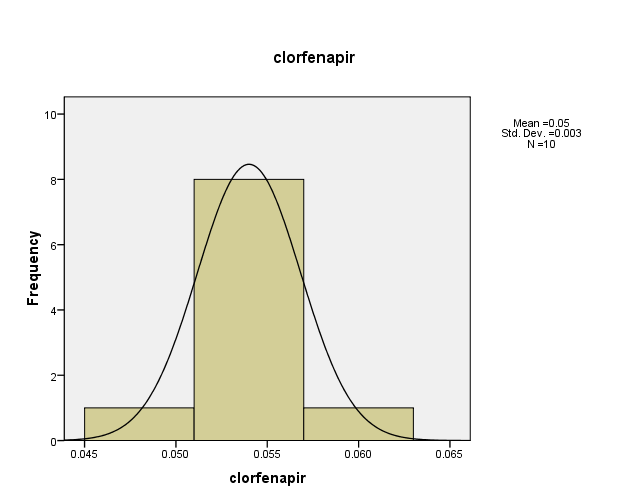
Figure (3) shows the distribution of concentrations (mg/L) and percentages of (Clorfenapir) in the soil samples, prepared by the researcher.
– Distribution of pesticide Clorfenvinphos concentrations in the (10) water samples, as shown in Figure (4). The consistency between the percentage and corrected percentage indicates the absence of missing concentrations. The high frequency of the value (0.042 ml/L) suggests that it is the most prevalent in the (10) water samples.
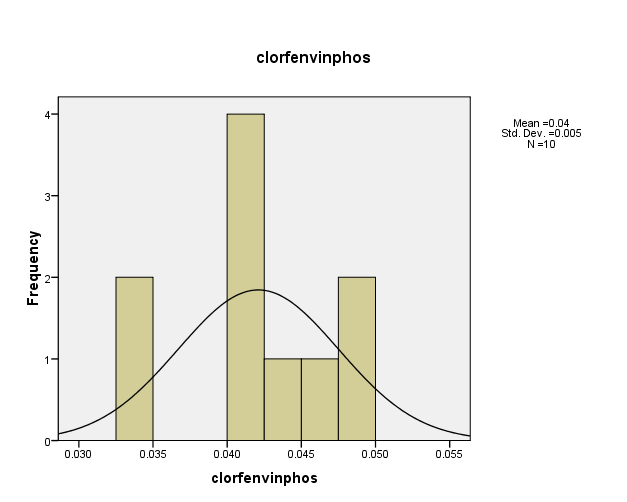
Figure (4) shows the distribution of concentrations (mg/L) and percentages of (Clorfenvinphos) in the soil samples, prepared by the researcher.
Distribution of pesticide Fenpropathrin concentrations in the (10) water samples, as shown in Figure (5). The consistency between the percentage and corrected percentage indicates the absence of missing concentrations. The high frequency of the value (0.038ml/L) suggests that it is the most prevalent in the (10) water samples.
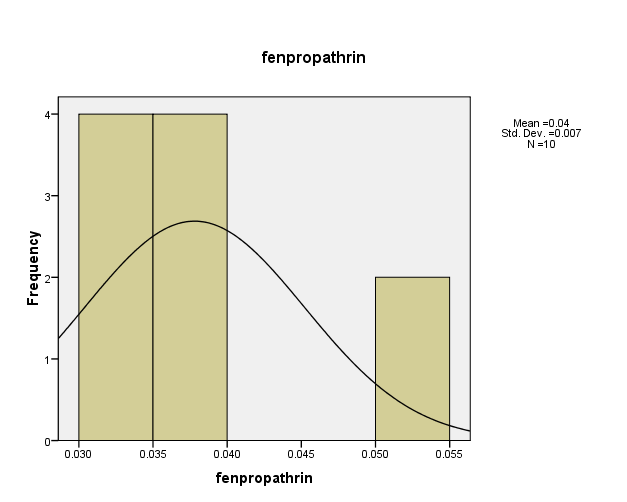
Figure (5) shows the distribution of concentrations (mg/L) and percentages of (Fenpropathrin) in the soil samples, prepared by the researcher.
Figure (6) showed that distribution of pesticide Malathion concentrations in the (10) water samples. The consistency between the percentage and corrected percentage indicates the absence of missing concentrations. The high frequency of the value (0.062ml/L) and (0.066ml/L) suggests that it is the most prevalent in the (10) water samples.
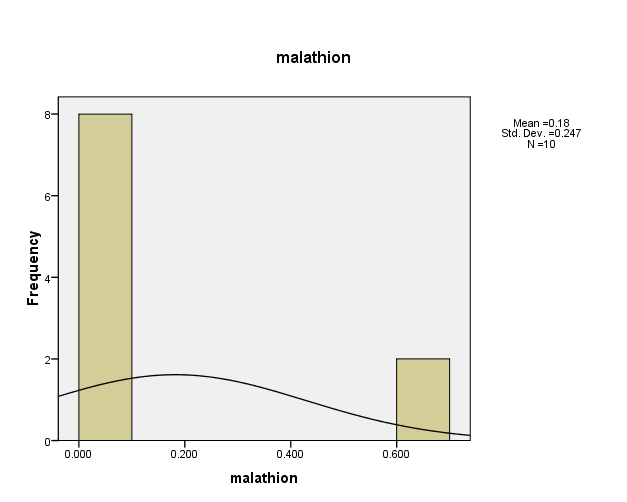
Figure (6) shows the distribution of concentrations (mg/L) and percentages of (Malathion) in the soil samples, prepared by the researcher.
Distribution of pesticide Parathion concentrations in the (10) water samples, as shown in Figure (7). The consistency between the percentage and corrected percentage indicates the absence of missing concentrations. The high frequency of the value (0.014ml/L) suggests that it is the most prevalent in the (10) water samples.
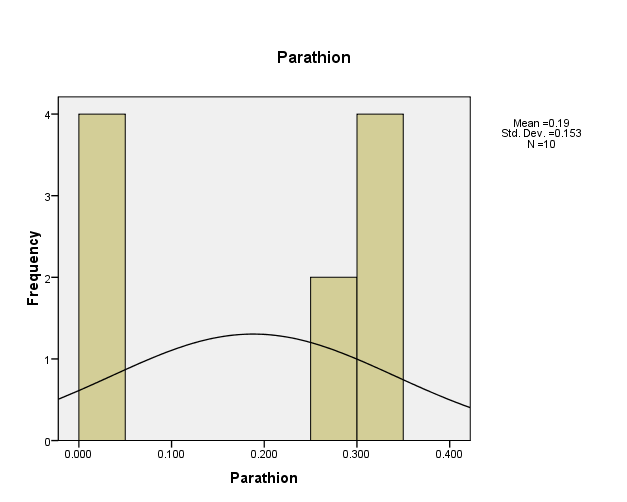
Figure (7) shows the distribution of concentrations (mg/L) and percentages of (Parathion) in the soil samples, prepared by the researcher.
Distribution of pesticide Pirimicarb concentrations in the (10) water samples, as shown in Figure (8). The consistency between the percentage and corrected percentage indicates the absence of missing concentrations. The smallest frequency of the value (0.033ml/L) and (0.034ml/L) suggests that it is the most prevalent in the (10) water samples.
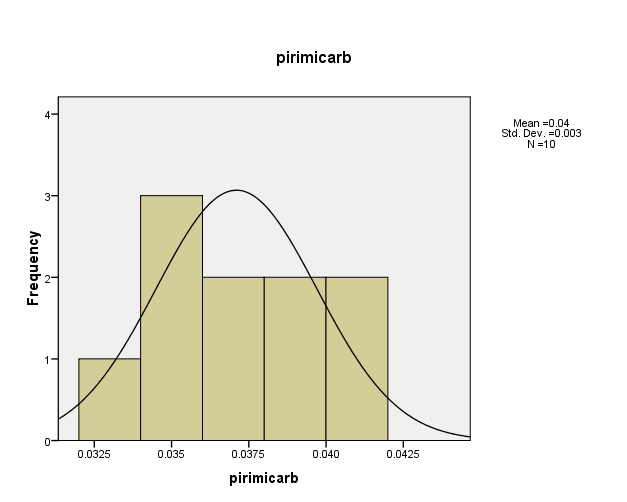
Figure (8) shows the distribution of concentrations (mg/L) and percentages of (Pirimicarb) in the soil samples, prepared by the researcher.
Figure (9) showed that, the distribution of pesticide Pirimiphosmethyl concentrations in the (10) water samples. The consistency between the percentage and corrected percentage indicates the absence of missing concentrations. The high frequency of the value (0.035 ml/L) and (0.039 ml/L) suggests that it is the most prevalent in the (10) water samples.
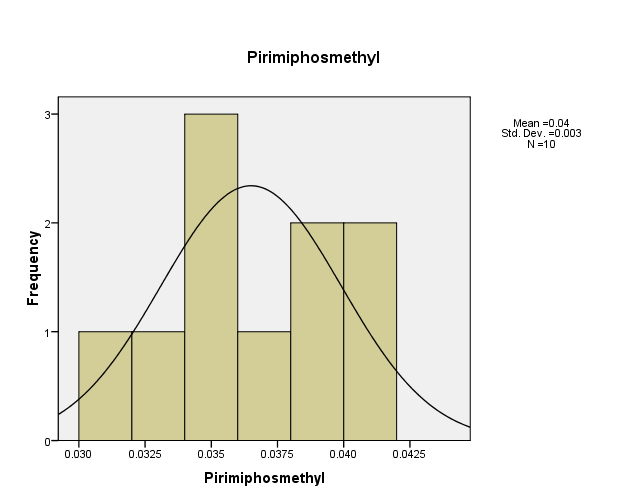
Figure (9) shows the distribution of concentrations (mg/L) and percentages of (Pirimiphosmethyl) in the soil samples, prepared by the researcher.
Distribution of pesticide Profenfos concentrations in the (10) water samples, as shown in Figure (10). The consistency between the percentage and corrected percentage indicates the absence of missing concentrations. The high frequency of the value (0.093 ml/L) suggests that it is the most prevalent in the (10) water samples.
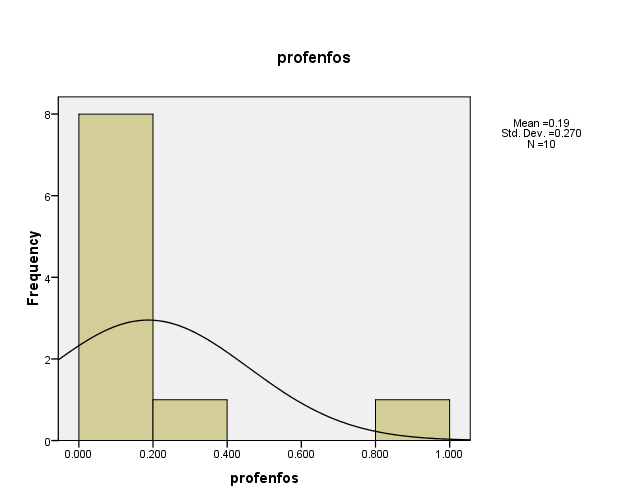
Figure (10) shows the distribution of concentrations (mg/L) and percentages of (Profenfos) in the soil samples, prepared by the researcher.
Distribution of pesticide Terbufos concentrations in the (10) water samples, as shown in Figure (11). The consistency between the percentage and corrected percentage indicates the absence of missing concentrations. The high frequency of the value (0.245ml/L) suggests that it is the most prevalent in the (10) water samples.
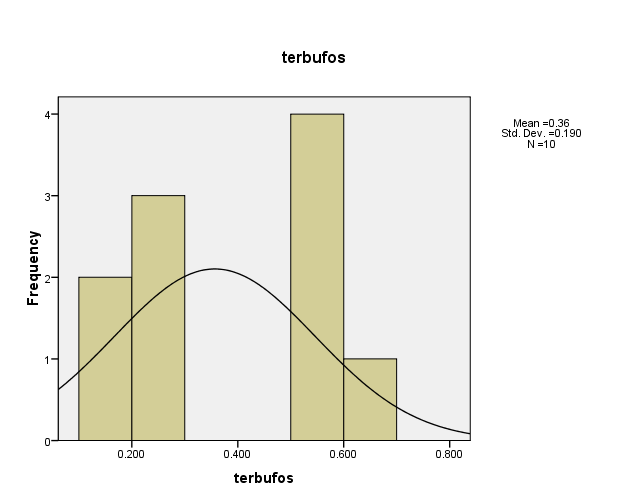
Figure (11) shows the distribution of concentrations (mg/L) and percentages of (Terbufos) in the soil samples, prepared by the researcher.
Distribution of pesticide Ethoprophos concentrations in the (10) water samples, as shown in Figure (12). The consistency between the percentage and corrected percentage indicates the absence of missing concentrations. The high frequency of the value (0.055 ml/L) suggests that it is the most prevalent in the (10) water samples.
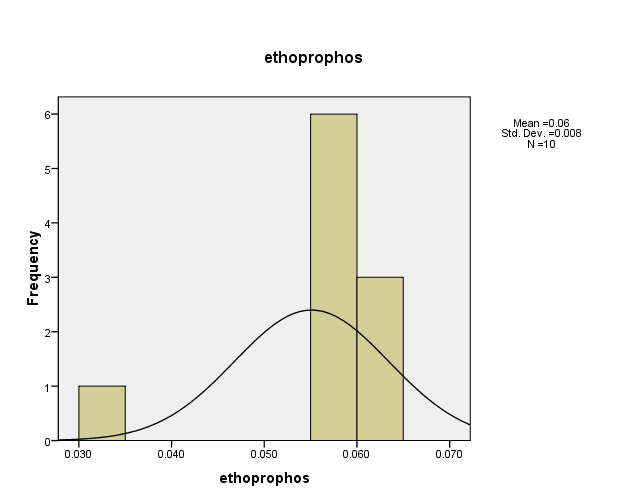
Figure (12) shows the distribution of concentrations (mg/L) and percentages of (Ethoprophos) in the soil samples, prepared by the researcher.
Distribution of pesticide Chlorfenvinphos concentrations in the (10) water samples, as shown in Figure (13). The consistency between the percentage and corrected percentage indicates the absence of missing concentrations. The high frequency of the value (0.06ml/L) suggests that it is the most prevalent in the (10) water samples.
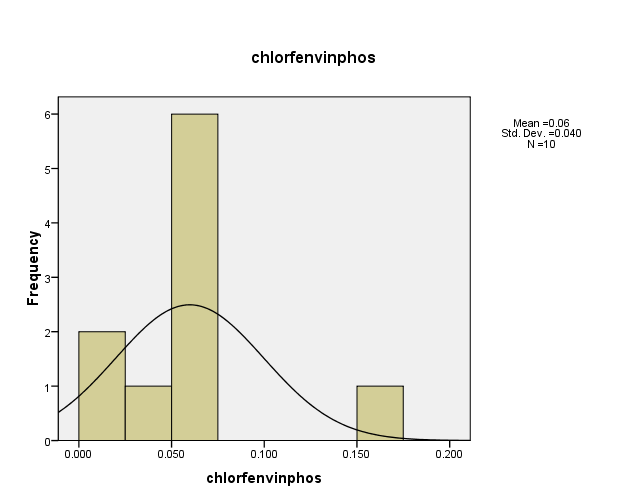
Figure (13) shows the distribution of concentrations (mg/L) and percentages of (Chlorfenvinphos) in the soil samples, prepared by the researcher.
Distribution of pesticide Cyprodinil concentrations in the (10) water samples, as shown in Figure (14). The consistency between the percentage and corrected percentage indicates the absence of missing concentrations. The high frequency of the value (0.016ml/L) suggests that it is the most prevalent in the (10) water samples
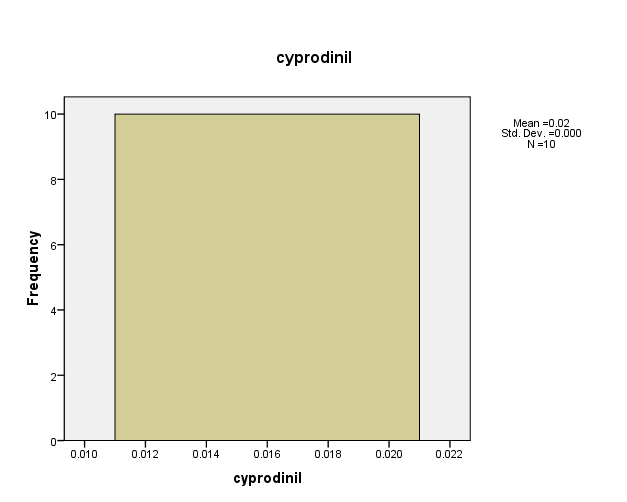
Figure (14) shows the distribution of concentrations (mg/L) and percentages of (Cyprodinil) in the soil samples, prepared by the researcher.
Distribution of pesticide Diazinon concentrations in the (10) water samples, as shown in Figure (14). The consistency between the percentage and corrected percentage indicates the absence of missing concentrations. The high frequency of the value (0.014ml/L) suggests that it is the most prevalent in the (10) water samples.
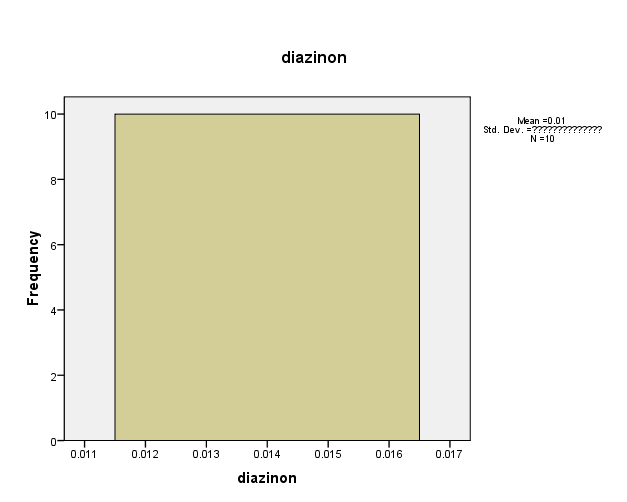
Figure (15) shows the distribution of concentrations (mg/L) and percentages of (Diazinon) in the soil samples, prepared by the researcher.
Distribution of pesticide Epoxiconazole concentrations in the (10) water samples, as shown in Figure (16). The consistency between the percentage and corrected percentage indicates the absence of missing concentrations. The high frequency of the value (0.021ml/L) suggests that it is the most prevalent in the (10) water samples
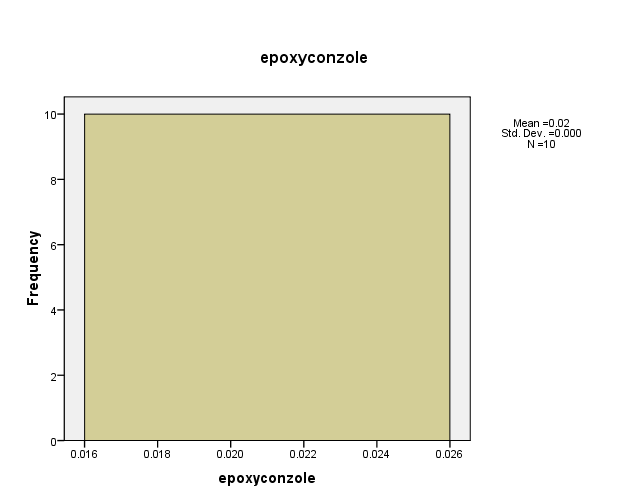
Figure (16) shows the distribution of concentrations (mg/L) and percentages of (Epoxiconazole) in the soil samples, prepared by the researcher.
- The study showed the presence of high concentrations of Terbufos, profenfos and parathion (0.357, 0.188, 0.187 mg/kg) respectively pesticides due to the intensive use of these pesticides in these areas. In results of the previous statistical data for water samples showed the presence of a variety of pesticides depending on the concentrations and the type of pesticide used, which indicates the widespread use of these pesticides in the sample collection areas.
T-Test to water samples:
Table No (1): shows the results of the (T-Test) test for pesticide concentrations in water samples, prepared by the researcher.
|
One-Sample Test |
||
|
Test Value = 0.001 |
||
|
Sig. (2-tailed) |
Mean Difference |
|
|
carboxin |
.000 |
.092000 |
|
Chloropyrifos |
.000 |
.068500 |
|
clorfenapir |
.000 |
.053000 |
|
clorfenvinphos |
.000 |
.041100 |
|
fenpropathrin |
.000 |
.036800 |
|
malathion |
.046 |
.181000 |
|
Parathion |
.004 |
.187000 |
|
pirimicarb |
.000 |
.036100 |
|
Pirimiphosmethyl |
.000 |
.035500 |
|
profenfos |
.058 |
.185800 |
|
terbufos |
.000 |
.355600 |
|
ethoprophos |
.000 |
.054100 |
|
chlorfenvinphos |
.001 |
.058800 |
|
cyprodinil |
.000 |
.015000 |
|
diazinon |
.000 |
.013000 |
|
epoxiconazole |
.000 |
.020000 |
The results showed that all pesticides, except for profenfos, had a Sig.(2-tailed) value less than 0.05, indicating a difference between the sample mean and the assumed mean (0.001 mg/L). The study found that the pesticides terbufos, Chloropyrifos, and carboxin had a large mean difference, indicating their presence in the samples at concentrations much higher than the assumed value (0.001 mg/L).
Discussion of results based on pesticides classification by use:
Based on the detected pesticides in the 10 water samples, these pesticides were classified according to their use into three groups: insecticides, herbicides, and fungicides. Through the previous statistical results of the samples, each group was discussed as follows:
Insecticides
The study found that the number of insecticides in the soil samples under study is (13) pesticides according to the table below.
Table No (2) shows the total average concentrations of pesticides for soil samples
|
total average concentration (mg/L) |
pesticide |
No |
|
0.070 |
Chloropyrifos |
1 |
|
0.054 |
clorfenapir |
2 |
|
0.042 |
clorfenvinphos |
3 |
|
0.038 |
fenpropathrin |
4 |
|
0.182 |
malathion |
5 |
|
0.188 |
Parathion methyl |
6 |
|
0.037 |
pirimicarb |
7 |
|
0.037 |
Pirimiphosmethyl |
8 |
|
0.187 |
profenfos |
9 |
|
0.566 |
terbufos |
10 |
|
0.055 |
ethoprophos |
11 |
|
0.060 |
chlorfenvinphos |
12 |
|
0.014 |
diazinon |
13 |
From table No (2), we find that pesticide (Terbufos) has the highest concentration with a total average concentration value of (0.566 mg/L), and pesticide (diazinon) has a concentration with a total average concentration value of (0.014mg/L).
Fungicides:
The study found that the number of fungicides in the soil samples under study is (3) fungicides.
Table No (3) shows the total average concentrations of fungicides for soil samples.
|
total average concentration (mg/L) |
pesticide |
No |
|
0.093 |
carboxin |
1 |
|
0.016 |
cyprodinil |
2 |
|
0.021 |
epoxiconazole |
3 |
From Table No (3), we find that pesticide (carboxin) has the highest concentration with a total average concentration value of (0.093 mg/L) and pesticide (cyprodinil) has a concentration with a total average concentration value of (0.016mg/L).
– Through the classification of pesticides detected in (10) water samples, the study showed that insecticides are the most dominant, outnumbering fungicides. This indicates the overuse of these types of pesticides, due to the nature of the region and the diversity of pests, which led to an increase in the concentrations of these pesticides.
– From the circular diagram showing the distribution of insecticide, herbicide, and fungicide percentages in the soil samples, according to the analysis of the soil samples, the figure shows that the highest percentage is for insecticides, followed by herbicides, and fungicides appear in lower percentages.
Figure No (17): Illustrates the percentage distributions of pesticide types by use in water samples.
Conclusion
The study concluded that there are residual concentration of pesticides used in agricultural area in the states of Kassala and Gedaref. Insecticides are more prevalent as residual concentrations compared to herbicides and fungicides. The study found that Gedarif state has a high intensity of pesticides use compared to Kassala state.
Acknowledgment
Authors to thanks the Kassala University and Red Sea University for supporting. And appreciation and gratitude for all of who supported this work with thanks.
References:
1.ABBADI, K. H. & ELZORGANI, G. A. 1981. Residues of DDT in soil of the Sudan Gezira. . 1st international congress for soil pollution and protection from pesticides residues, 22-28.
2.ABDELBAGI, A. O. 2005. Level of POPs chemicals in the environment and human exposure, consultancy report, Project. HCENR, Sudan and UNIDO.
3.ABDELBAGI, A. O. 2006. Pesticide use and management in the Sudan. National Workshop on Insecticide Resistance and Its Management, 29 – 31.
4.ABDELBAGI, A. O., ELMAHI, A. M. & OSMAN, D. G. 2003. Organochlorine insecticides residues in Sudanese soil of intensive pesticide use and in surface soil of Qurashi pesticide store. U. of K. J. of Agric. Sci, 59-68.
5.ABDELBAGI, A. O., ELMAHI, M. A. & OSMAN, D. G. 2000. Chlorinated hydrocarbon insecticide residues in the Sudanese soils of limited or no pesticide use. Arab Journal of Plant Protection, 35-39.
6.ABDELBAGI, A. O., OSMAN, G. A., MOHMAD, A. A., OMER, S., ALI, F. M., SAAD, A. & MUKHTAR, N. 2007. The manual of pesticide use in the Sudan SSMO. Khartoum Univarsity press.
7.AHMED 2007. studyof levels of pesticides residues in nile water in sudan un.of.kh.
8.ALAVANJA, M., HOPPIN JA & KAMEL F 2004. Health effects of chronic pesticide exposure. Cancer and neurotoxicity Annual Reviews of Public Health, 25, 155–197.
9.ALHINDI, A. M. 1981. Progress report of the National Chemical Laborotaries (NCL). Minstry of Health, Khartoum, Sudan.
10.ALI, T. M. 2005. The potential of naturally occurring soil microorganisms in degrading endosulfan α, β and lindane; A case study of Qurashi pesticide store. M. Sc. Thesis, Facuty of Agriculture, University of Khartoum.