

Transformational Leadership and the Educational Environment in Private Secondary Schools in Bethlehem Governorate: A Cross-Sectional Study
القيادة التحويلية والبيئة التعليمية في المدارس الثانوية الخاصة بمحافظة بيت لحم: دراسة مقطعية
Dr. Samira Ibrahim Mohammad Oraikat1
1 Independent Researcher, Palestine.
Email: Samar.269.ie@gmail.com
DOI: https://doi.org/10.53796/hnsj79/19
Arabic Scientific Research Identifier: https://arsri.org/10000/79/19
Volume (7) Issue (9). Pages: 398 - 417
Received at: 2026-08-08 | Accepted at: 2026-08-15 | Published at: 2026-09-01
Abstract: This study investigated the relationship between transformational leadership and the educational environment in private secondary schools in Bethlehem Governorate, Palestine. A descriptive-analytical, cross-sectional survey design was employed. The population comprised 483 teachers, of whom 214 were selected through simple random sampling. Data were collected using a 55-item questionnaire measuring four transformational-leadership dimensions—idealized influence, inspirational motivation, individualized consideration, and intellectual stimulation—and two educational-environment dimensions: human and non-human elements. Statistically significant item–dimension and dimension–total correlations supported construct validity, and the instrument demonstrated excellent internal consistency (Cronbach’s α = .971). The findings showed high levels of transformational leadership (M = 3.87, SD = .951), with inspirational motivation ranking first (M = 3.93), and educational-environment quality (M = 3.97, SD = .870), with human elements (M = 3.99) slightly exceeding non-human elements (M = 3.95). Transformational leadership was strongly associated with the educational environment (R = .864, R² = .746, adjusted R² = .745, p < .001). The four leadership dimensions jointly explained 75.2% of the variance, with intellectual stimulation producing the strongest unique standardized effect (β = .348). Gender differences were non-significant, whereas age, academic qualification, and teaching experience yielded significant small-to-moderate effects. Given the cross-sectional, self-reported design and absence of school-level identifiers, the findings indicate strong predictive relationships rather than causality. The study recommends integrated leadership development, participatory decision-making, individualized professional support, and sustained investment in inclusive digital and physical learning environments.
Keywords: Transformational Leadership; Educational Environment; Private Secondary Schools; Bethlehem Governorate.
المستخلص: هدفت هذه الدراسة إلى استقصاء العلاقة بين القيادة التحويلية والبيئة التعليمية في المدارس الثانوية الخاصة بمحافظة بيت لحم في فلسطين. واعتمدت الدراسة المنهج الوصفي التحليلي بتصميم مسحي مقطعي. تكوّن مجتمع الدراسة من (483) معلماً ومعلمة، اختير منهم (214) بطريقة العينة العشوائية البسيطة. وجُمعت البيانات باستخدام استبانة مكوّنة من (55) فقرة، تقيس أربعة أبعاد للقيادة التحويلية، هي: التأثير المثالي، والتحفيز الإلهامي، والاعتبار الفردي، والاستثارة الفكرية، إلى جانب بُعدين للبيئة التعليمية، هما: العناصر البشرية والعناصر غير البشرية. وأظهرت معاملات الارتباط الدالة إحصائياً بين الفقرات وأبعادها، وبين الأبعاد والدرجة الكلية، توافر صدق البناء، كما أظهرت الأداة مستوى ممتازاً من الاتساق الداخلي، إذ بلغ معامل ألفا كرونباخ (α = 0.971). أظهرت النتائج ارتفاع مستوى القيادة التحويلية (M = 3.87، SD = 0.951)، وجاء بُعد التحفيز الإلهامي في المرتبة الأولى (M = 3.93). كما ارتفع مستوى جودة البيئة التعليمية (M = 3.97، SD = 0.870)، وتفوّقت العناصر البشرية بدرجة طفيفة (M = 3.99) على العناصر غير البشرية (M = 3.95). وارتبطت القيادة التحويلية ارتباطاً قوياً بالبيئة التعليمية (R = 0.864، R² = 0.746، وR² المعدّل = 0.745، p < 0.001). كما فسّرت أبعاد القيادة التحويلية الأربعة مجتمعةً ما نسبته (75.2%) من التباين في البيئة التعليمية، وكان بُعد الاستثارة الفكرية صاحب أقوى أثر معياري فريد (β = 0.348). ولم تظهر فروق دالة إحصائياً تُعزى إلى الجنس، في حين أظهرت متغيرات العمر والمؤهل العلمي والخبرة التدريسية تأثيرات دالة إحصائياً تراوحت بين الصغيرة والمتوسطة. ونظراً إلى اعتماد الدراسة تصميماً مقطعياً وبيانات قائمة على التقارير الذاتية، فضلاً عن عدم تضمين معرّفات خاصة بالمدارس، فإن النتائج تشير إلى علاقات تنبؤية قوية، ولا تثبت وجود علاقة سببية. وتوصي الدراسة بتطوير برامج متكاملة لتنمية المهارات القيادية، وتعزيز المشاركة في اتخاذ القرارات، وتقديم الدعم المهني الفردي، ومواصلة الاستثمار في بيئات تعلم رقمية ومادية شاملة.
الكلمات المفتاحية: القيادة التحويلية؛ البيئة التعليمية؛ المدارس الثانوية الخاصة؛ محافظة بيت لحم.
1. Introduction
Educational leadership is the institutional process through which school vision, professional expectations, organizational values, and resource decisions are translated into teaching and learning practices. Rapid educational, technological, and social transformations have increased the need for leadership that moves beyond routine supervision toward participation, motivation, innovation, and sustained professional development. Transformational leadership provides an appropriate framework for mobilizing school personnel and aligning their professional growth with institutional improvement (Saleh & Al-Mubaideen, 2023).
The conceptual foundations of transformational leadership distinguish transactional exchanges from leadership that elevates motivation, commitment, and collective purpose (Burns, 1978). Bass (1985) further developed the concept as a model for achieving performance beyond conventional expectations. It comprises four integrated dimensions: idealized influence, which promotes credibility and ethical role modeling; inspirational motivation, which articulates a shared vision; intellectual stimulation, which encourages critical thinking and innovation; and individualized consideration, which responds to teachers’ distinct professional needs.
The educational environment is also multidimensional. Its human elements encompass teachers, students, administrators, professional relationships, communication, participation, support, and psychological safety. Its non-human elements include curricula, classrooms, facilities, technologies, libraries, activities, and organizational arrangements. Contemporary perspectives emphasize that a high-quality educational environment also requires inclusion, belonging, equity, and meaningful opportunities for participation, rather than being limited to physical readiness or academic achievement (Heinz et al., 2025).
Palestinian private schools provide a relevant context for examining this relationship. These non-governmental institutions possess a degree of administrative and financial independence while remaining subject to national curricula and educational regulations (Ministry of Education and Higher Education–Palestine, 2022). Although this position may enhance organizational flexibility, it also creates pressures related to maintaining educational quality, meeting family expectations, competing for enrolment, and developing human and material resources. Transformational leadership may therefore determine the extent to which institutional autonomy contributes to a supportive, coherent, and inclusive educational environment.
Previous research has associated transformational leadership with crisis management in private schools (Al-Khataybeh, 2022), educational-quality standards and job satisfaction (Abdel Qader, 2024), collaborative school culture (Sasan et al., 2023), teachers’ responses to technological reform (Laursen & Weiss, 2025), and school performance through motivation, trust, and collaboration (Sianipar & Putri, 2024). Studies of educational environments have similarly linked school safety and leadership support to teachers’ professional functioning (Abu Aldibs, 2024) and connected students’ perceptions of the educational environment with their cognitive, behavioral, and emotional engagement (Kassab et al., 2024). Nevertheless, a contextual gap remains concerning the combined relationship of the four transformational-leadership dimensions with both the human and non-human elements of the educational environment in private secondary schools in Bethlehem Governorate.
1.1 Research Problem
Private secondary schools in Bethlehem Governorate face the dual challenge of sustaining a motivating and supportive human climate while developing the physical, technological, curricular, and organizational conditions required for contemporary education. The quality of the educational environment is no longer limited to the adequacy of buildings and learning resources; it also encompasses professional relationships, participation, inclusion, psychological safety, and equitable opportunities for teaching and learning (Heinz et al., 2025).
Transformational leadership may provide an appropriate framework for addressing these challenges because its four dimensions—idealized influence, inspirational motivation, intellectual stimulation, and individualized consideration—focus on articulating a shared vision, motivating teachers, encouraging innovative thinking, and responding to individual professional needs. Previous studies have associated these practices with teachers’ professional development (Al-Kuhaileh, 2024), effective crisis management in private schools (Al-Khataybeh, 2022), and improved teacher performance, organizational commitment, and work culture (Kailola, 2017).
However, the research problem extends beyond determining whether school principals exhibit transformational-leadership behaviors. It concerns whether the four dimensions are practiced in a balanced manner and whether teachers’ perceptions of these practices are statistically associated with a comprehensive assessment of the human and non-human elements of the educational environment. This issue is particularly important because transformational leadership has been shown to promote empowerment, participation, and collaborative school culture, yet its implementation may vary according to institutional and contextual conditions (Sasan et al., 2023).
Accordingly, the present study addresses a contextual and analytical gap by examining the levels of transformational leadership and the educational environment in private secondary schools in Bethlehem Governorate, determining the strength of the relationship between them, assessing the relative contribution of each transformational-leadership dimension to explaining variations in the educational environment, and identifying differences in teachers’ overall responses according to selected demographic and professional characteristics.
1.2 Research Questions
The main research question was:
Main. What is the role of transformational leadership in developing the educational environment in private secondary schools in Bethlehem Governorate?
The following sub-questions were derived from the main question:
1. To what extent do principals in private secondary schools in Bethlehem Governorate adhere to the dimensions of transformational leadership, namely idealized influence, inspirational motivation, individualized consideration, and intellectual stimulation?
2. What is the current state of the educational environment in private secondary schools in Bethlehem Governorate, including its human and non-human elements?
3. Is there a statistically significant correlation at α ≤ .05 between principals’ adherence to transformational-leadership dimensions and the development of the educational environment in the schools under study?
4. Are there statistically significant differences at α ≤ .05 in teachers’ responses to the study scale attributable to gender, age, academic qualification, and years of experience?
1.3 Research Hypotheses
In accordance with the source study, the inferential questions were tested through the following null hypotheses:
1. H01: There is no statistically significant correlation at α ≤ .05 between principals’ adherence to transformational-leadership dimensions and the educational environment in the schools under study.
2. H02: There are no statistically significant differences at α ≤ .05 in teachers’ responses to the study scale attributable to gender.
3. H03: There are no statistically significant differences at α ≤ .05 in teachers’ responses to the study scale attributable to age.
4. H04: There are no statistically significant differences at α ≤ .05 in teachers’ responses to the study scale attributable to academic qualification.
5. H05: There are no statistically significant differences at α ≤ .05 in teachers’ responses to the study scale attributable to years of experience.
1.4 Study Objectives
1. Determine the extent to which principals practice idealized influence, inspirational motivation, individualized consideration, and intellectual stimulation.
2. Assess the educational environment in terms of human and non-human elements.
3. Measure the association between transformational leadership and the educational environment and examine the relative statistical contribution of the four leadership dimensions.
4. Test differences in overall study-scale responses according to gender, age, academic qualification, and years of experience.
5. Formulate evidence-based recommendations for leadership development and educational-environment improvement in private secondary schools.
1.5 Study Delimitations
1. Spatial delimitation: Private secondary schools located in Bethlehem Governorate, Palestine.
2. Temporal delimitation: The second semester of the 2024–2025 academic year.
3. Human delimitation: Male and female teachers employed in the target private secondary schools.
4. Conceptual delimitation: Transformational leadership as idealized influence, inspirational motivation, individualized consideration, and intellectual stimulation; educational environment as human and non-human elements.
5. Procedural delimitation: Teachers’ self-reported responses to a 55-item, five-point Likert questionnaire and the statistical analyses documented in the source study.
1.6 Analytical Model
The study treated transformational leadership as the independent construct and the educational environment as the dependent construct. The four leadership dimensions were entered simultaneously in a multiple-regression model to estimate their unique standardized contributions. Gender, age, academic qualification, and years of experience were used as grouping variables for the overall study-scale analysis. The model is interpretive and predictive, not causal, because all variables were measured at one time from the same respondents.
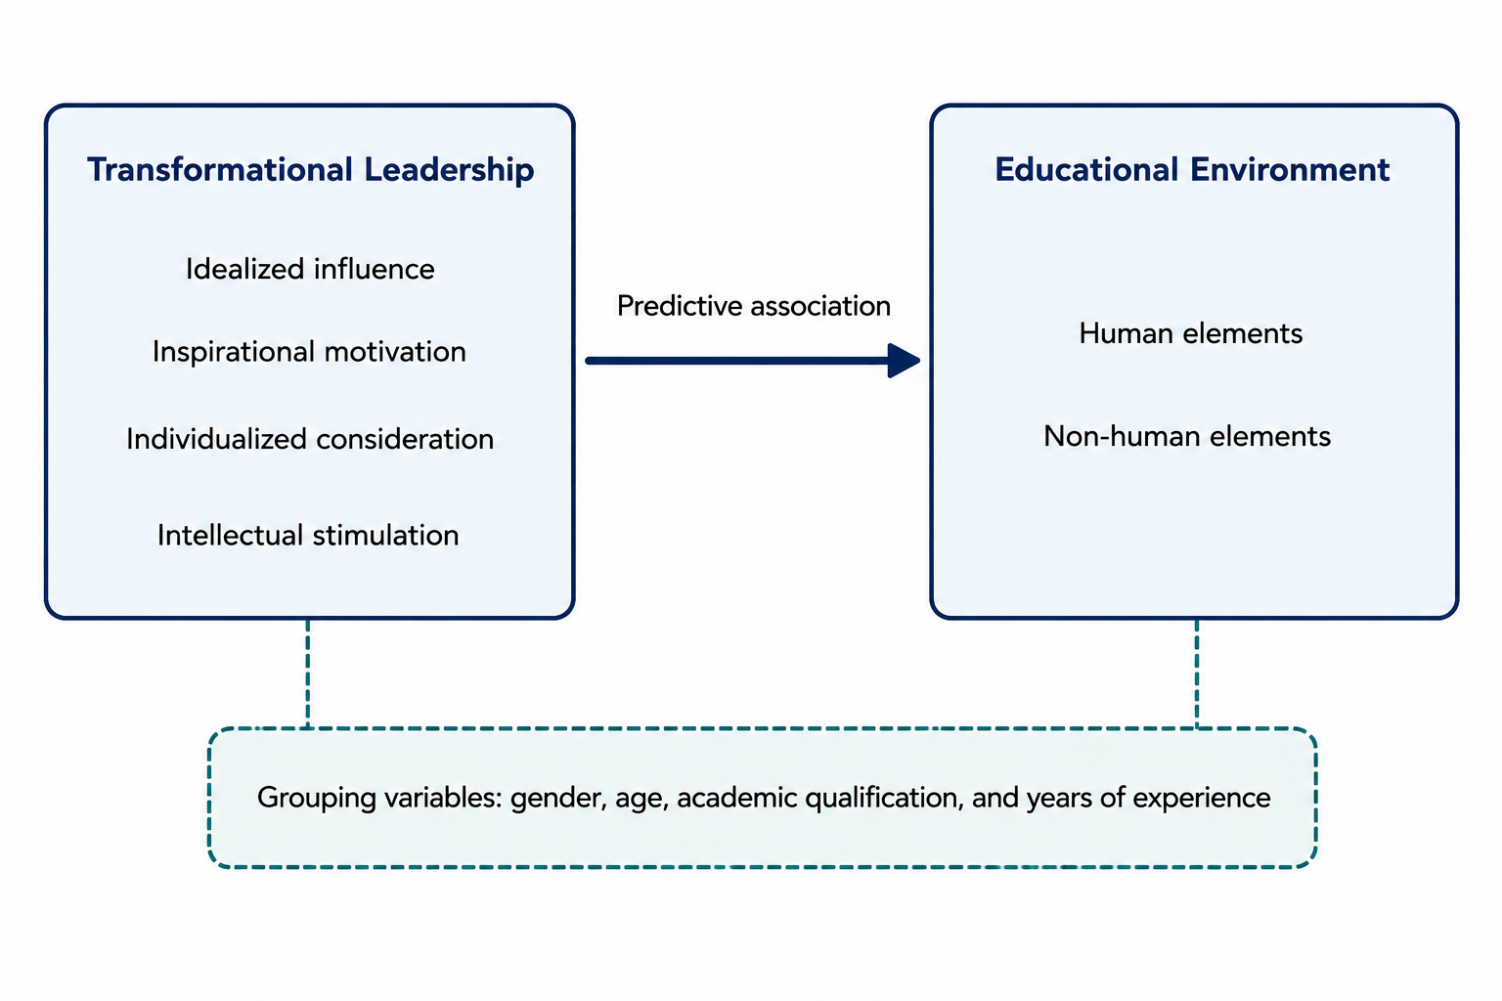
Figure (1) Analytical model of the study
Source: Developed from the variables and analyses specified in the source study.
2. Methodology
2.1 Research Design
The study employed a descriptive-analytical, cross-sectional survey design. This design was appropriate for estimating the levels of transformational leadership and the educational environment, examining the statistical associations between them, and testing differences in participants’ responses across independent demographic and professional groups using data collected at a single point in time. The term predictive is used exclusively in its statistical sense; regression analysis estimates the contribution of the included predictors to variations in the outcome variable but does not establish temporal precedence or causal relationships.
2.2 Population and Sample
The study population comprised all 483 male and female teachers employed in private secondary schools in Bethlehem Governorate during the 2024–2025 academic year, according to official statistics obtained from the Directorate of Education. The study sample consisted of 214 teachers selected through simple random sampling, consistent with the sample-size guidelines proposed by Krejcie and Morgan (1970). All 214 returned questionnaires were deemed complete and valid for statistical analysis.
The available study records do not specify the number of teachers initially invited to participate, the number of schools represented in the sample, the operational sampling frame, or the procedures used to address non-response or replace unavailable participants. Consequently, the response rate and the degree of school-level representation cannot be calculated. This limitation should be considered when interpreting the representativeness and generalizability of the findings.
Table 1: Distribution of the Study Sample According to Demographic and Professional Characteristics
|
Variable |
Category |
n |
% |
|---|---|---|---|
|
Gender |
Male |
66 |
30.8 |
|
Female |
148 |
69.2 |
|
|
Age |
Less than 30 years |
38 |
17.8 |
|
30 to less than 40 years |
108 |
50.5 |
|
|
40 to less than 50 years |
47 |
22.0 |
|
|
50 years and above |
21 |
9.8 |
|
|
Academic qualification |
Bachelor’s degree |
179 |
83.6 |
|
Professional diploma in education |
17 |
7.9 |
|
|
Master’s degree and above |
18 |
8.4 |
|
|
Years of experience |
Less than 5 years |
33 |
15.4 |
|
5 to less than 10 years |
63 |
29.4 |
|
|
10 to less than 15 years |
73 |
34.1 |
|
|
15 years and above |
45 |
21.0 |
2.3 Study Instrument and Scoring
Data were collected using a questionnaire developed through a review of relevant Arab and international literature and subsequently refined through specialist evaluation. The final instrument comprised 55 items distributed across two principal constructs. Transformational leadership was measured by 24 items covering four dimensions: idealized influence, inspirational motivation, individualized consideration, and intellectual stimulation. The educational environment was measured by 31 items distributed across two dimensions: human and non-human elements.
Responses were recorded on a five-point Likert-type scale ranging from 1 to 5. Accordingly, possible total scores ranged from 24 to 120 for transformational leadership, from 31 to 155 for the educational environment, and from 55 to 275 for the complete instrument. Because the source study did not specify the verbal anchor associated with each numerical response category, the present study reports the documented numerical scoring system without assigning unverified response labels.
Table 2: Structure of the Study Questionnaire
|
Construct |
Dimension |
Number of items |
|---|---|---|
|
Transformational leadership |
Idealized influence |
6 |
|
Inspirational motivation |
6 |
|
|
Individualized consideration |
6 |
|
|
Intellectual stimulation |
6 |
|
|
Total transformational leadership |
24 |
|
|
Educational environment |
Human elements |
15 |
|
Non-human elements |
16 |
|
|
Total educational environment |
31 |
|
|
Full instrument |
All measured items |
55 |
Note. Responses were scored numerically from 1 to 5. The verbal anchors corresponding to these values were not documented in the available source materials and were therefore not reconstructed.
To interpret the arithmetic means, the range of the response scale was divided into five equal intervals. The interval length was calculated by subtracting the minimum scale value from the maximum value and dividing the result by the number of interpretive levels: (5 − 1) ÷ 5 = 0.80. Mean scores were subsequently classified as very low, low, moderate, high, or very high, as presented in Table 3.
Table 3: Criteria Used to Interpret Mean Scores
|
Mean interval |
Relative mean (%) |
Interpretive level |
|---|---|---|
|
1.00–1.80 |
20.0–36.0 |
Very low |
|
>1.80–2.60 |
>36.0–52.0 |
Low |
|
>2.60–3.40 |
>52.0–68.0 |
Moderate |
|
>3.40–4.20 |
>68.0–84.0 |
High |
|
>4.20–5.00 |
>84.0–100.0 |
Very high |
Note. The interpretive intervals were derived using the 0.80 cell-length procedure documented in the source study. Relative means were calculated by dividing the arithmetic mean by the maximum scale value and multiplying the result by 100.
2.4 Validity and Reliability
Content validity was established by submitting the initial questionnaire to a panel of specialists and revising its items in accordance with their observations. However, the source study did not report the number of reviewers, their disciplinary backgrounds, or the level of agreement among them; therefore, the strength of the content-validity evidence cannot be evaluated beyond the documented review procedure.
Internal-consistency validity was examined by calculating Pearson’s correlation coefficients between each item and the dimension to which it belonged. Evidence of construct-related validity was further assessed through correlations between each dimension and its corresponding total construct score. As shown in Table 4, all item–dimension and dimension–total correlations were positive and statistically significant at p < .01, supporting the internal coherence of the questionnaire structure.
Reliability was assessed using Cronbach’s alpha. The coefficients ranged from .839 to .912 for the individual dimensions, while the coefficients for transformational leadership and the educational environment were .950 and .946, respectively. The full instrument yielded an alpha coefficient of .971, indicating very high internal consistency.
Table 4: Validity Indicators and Cronbach’s Alpha Coefficients
|
Scale or dimension |
Items |
Item–dimension r |
Dimension–total r |
Cronbach’s α |
|---|---|---|---|---|
|
Idealized influence |
6 |
.667–.743 |
.878 |
.908 |
|
Inspirational motivation |
6 |
.630–.674 |
.873 |
.839 |
|
Individualized consideration |
6 |
.625–.804 |
.893 |
.872 |
|
Intellectual stimulation |
6 |
.594–.692 |
.829 |
.871 |
|
Human elements |
15 |
.440–.689 |
.955 |
.891 |
|
Non-human elements |
16 |
.492–.703 |
.964 |
.912 |
|
Total transformational leadership |
24 |
— |
— |
.950 |
|
Total educational environment |
31 |
— |
— |
.946 |
|
Full instrument |
55 |
— |
— |
.971 |
Note. All item–dimension and dimension–total correlations were statistically significant at p < .01. Although the full-scale alpha coefficient indicates very high internal consistency, its magnitude may partly reflect the number of items and possible conceptual overlap among them. Cronbach’s alpha should therefore not be interpreted as evidence that the instrument is unidimensional.
2.5 Data-Collection Procedures and Ethical Reporting
The documented data-collection procedures included reviewing the relevant literature, developing the questionnaire, submitting it for specialist review, and revising it accordingly. An official authorization letter was obtained from the university and presented to the relevant educational authorities and participating schools. The questionnaire was subsequently converted into an electronic format and distributed to teachers through email and staff social-media groups. The completed responses were then coded and subjected to statistical analysis.
The available records do not specify an institutional ethics-committee approval number, the form of informed consent, procedures for ensuring anonymity or confidentiality, participants’ right to withdraw, or arrangements for data storage and retention. These procedures are therefore not claimed in the present article. Before journal submission, verified information concerning ethical approval, informed consent, confidentiality, and data management should be incorporated from the original fieldwork records, where available.
2.6 Statistical Analysis and Reporting Boundaries
The data were analyzed using SPSS, version 23, as reported in the methodology of the source study. Frequencies and percentages were used to describe the demographic characteristics of the sample. Means, standard deviations, relative means, and ranks were calculated to determine the levels of transformational leadership and the educational environment. Pearson’s correlation coefficient was employed to examine item–dimension correlations, dimension–total correlations, and the association between the principal study constructs.
Simple linear regression was used to estimate the association between the overall transformational-leadership score and the educational environment, whereas multiple linear regression assessed the relative statistical contribution of the four leadership dimensions. Independent-samples t tests examined gender differences, while one-way analysis of variance and Scheffé post hoc comparisons were used to test differences according to age, academic qualification, and years of experience.
To strengthen inferential reporting, additional statistics were derived from the available summary results, including Cohen’s d for the gender comparison, η² and ω² for the analyses of variance, adjusted R² values, a confidence interval for the gender mean difference, and approximate confidence intervals for standardized regression coefficients. These derived estimates are explicitly identified in the relevant table notes.
However, the raw dataset, school-level identifiers, complete unstandardized regression coefficients, residual diagnostics, and separate demographic analyses for the two principal constructs were unavailable. Consequently, no multilevel adjustment, independent re-analysis, unstandardized regression equation, or separate demographic testing for transformational leadership and the educational environment was undertaken or inferred.
3. Results
3.1 Results for Research Question 1: Level of Transformational Leadership
Transformational leadership was perceived at a high overall level (M = 3.87, SD = .951; relative mean = 77.4%). Inspirational motivation ranked first (M = 3.93), followed by intellectual stimulation (M = 3.88), idealized influence (M = 3.87), and individualized consideration (M = 3.83). The limited difference of .10 between the highest- and lowest-ranked dimensions indicates a relatively consistent pattern of transformational-leadership practice. Nevertheless, the comparatively lower mean for individualized consideration suggests that personalized professional support constitutes the principal area for further development. Because all four dimensions were rated high, their rankings should be interpreted comparatively rather than as evidence of substantive weakness.
Table 5: Descriptive Results for Transformational-Leadership Dimensions
|
Dimension |
M |
SD |
Relative mean (%) |
Rank |
Level |
|---|---|---|---|---|---|
|
Inspirational motivation |
3.93 |
.912 |
78.6 |
1 |
High |
|
Intellectual stimulation |
3.88 |
.937 |
77.6 |
2 |
High |
|
Idealized influence |
3.87 |
.981 |
77.4 |
3 |
High |
|
Individualized consideration |
3.83 |
.976 |
76.6 |
4 |
High |
|
Overall transformational leadership |
3.87 |
.951 |
77.4 |
— |
High |
Item-level results provide a more differentiated interpretation of this overall pattern. The most prominent practices concerned teamwork, the articulation of a clear future vision, and recognition of employees’ efforts. Comparatively lower means were recorded for involving employees in goal setting and implementation, recognizing their overall achievements, accepting their perspectives as a basis for collective learning, and establishing infrastructure conducive to creativity. These findings suggest that principals were perceived as relatively effective in motivating collective effort and communicating direction, but less consistent in distributing participation, individualizing recognition, and providing the structural conditions required for innovation.
Table 6: Selected Diagnostic Indicators of Transformational-Leadership Practice
|
Dimension |
Selected item |
M |
Interpretive status |
|---|---|---|---|
|
Idealized influence |
Possesses a clear future vision |
3.95 |
Relative strength |
|
Idealized influence |
Accepts employees’ opinions because of the importance of collective learning |
3.79 |
Developmental need |
|
Inspirational motivation |
Encourages work to be performed in a team spirit |
4.03 |
Highest verified indicator |
|
Inspirational motivation |
Participates with employees in setting and implementing goals |
3.85 |
Developmental need |
|
Individualized consideration |
Values employees’ efforts regardless of level of participation |
3.91 |
Relative strength |
|
Individualized consideration |
Appreciates the overall achievements of school employees |
3.75 |
Lowest within dimension |
|
Intellectual stimulation |
Searches for non-traditional methods to accomplish tasks |
3.89 |
Relative strength |
|
Intellectual stimulation |
Creates an appropriate infrastructure that promotes creativity |
3.81 |
Developmental need |
Note. Only item wording and mean values that could be verified from the tabulated source record were retained. The source contained inconsistencies between its narrative interpretation and statistical tables regarding the highest-rated idealized-influence item and the wording of the intellectual-stimulation item with a reported mean of 3.97. These disputed entries were therefore excluded rather than reconstructed or silently reconciled.
3.2 Results for Research Question 2: Status of the Educational Environment
The educational environment was perceived at a high overall level (M = 3.97, SD = .870; relative mean = 79.4%). Human elements ranked first (M = 3.99), followed closely by non-human elements (M = 3.95). The difference between the two dimensions was only .04, indicating a broadly balanced educational environment. Nevertheless, the descriptive pattern suggests that relational, social, and professional conditions were perceived as marginally stronger than the material, technological, and organizational conditions supporting teaching and learning.
Table 7: Descriptive Results for Educational-Environment Dimensions
|
Dimension |
M |
SD |
Relative mean (%) |
Rank |
Level |
|---|---|---|---|---|---|
|
Human elements |
3.99 |
.839 |
79.8 |
1 |
High |
|
Non-human elements |
3.95 |
.901 |
79.0 |
2 |
High |
|
Overall educational environment |
3.97 |
.870 |
79.4 |
— |
High |
The item-level results provide further insight into the strengths and developmental priorities of the educational environment. Within the human dimension, the highest-rated indicators concerned participation in staff social occasions, reinforcement of teachers’ role-model behavior, provision of safety and comfort, teamwork, and professional workshops. By contrast, granting teachers sufficient authority and resources for professional development received the lowest mean, indicating a relative gap between supporting teachers socially and enabling them professionally.
Within the non-human dimension, the use of social-media platforms to communicate with parents emerged as the strongest indicator, followed by the organization of sports activities. In contrast, the provision of a digital library received the lowest mean, while classroom design responsive to the needs of all students, including students with disabilities, was also rated comparatively lower. These findings indicate that communication and extracurricular activity were more strongly established than digital-resource provision and inclusive physical design.
Table 8: Selected Diagnostic Indicators of the Educational Environment
|
Element |
Selected item |
M |
Interpretive status |
|---|---|---|---|
|
Human |
Participates in school staff social occasions |
4.20 |
Relational strength |
|
Human |
Reinforces teachers’ role-model behavior when facing challenges |
4.14 |
Professional strength |
|
Human |
Provides comfort and safety that support confident development |
4.11 |
Climate strength |
|
Human |
Grants teachers the authority and resources needed for professional development |
3.82 |
Primary human gap |
|
Non-human |
Uses social media platforms to communicate with parents |
4.12 |
Communication strength |
|
Non-human |
Organizes sports activities inside the school or with other schools |
4.07 |
Activity strength |
|
Non-human |
Designs classrooms to meet all students’ needs, including disabilities |
3.86 |
Inclusive-design need |
|
Non-human |
Provides a digital library for access to educational materials |
3.76 |
Primary material gap |
Note. Interpretive labels are comparative and diagnostic. All selected indicators remained within the high level according to the adopted scale criterion.
3.3 Results for Research Question 3 and H01: Total-Score Association
The results revealed a strong, positive, and statistically significant association between the total transformational-leadership score and the overall educational-environment score (R = .864, p < .001). The regression model was statistically significant, F(1, 212) = 624.059, p < .001, and explained 74.6% of the variance in educational-environment scores (R² = .746; adjusted R² = .745). Accordingly, the first null hypothesis (H01), which assumed no statistically significant relationship between transformational leadership and the educational environment, was rejected.
The standardized regression coefficient was substantial and positive (β = .864, t = 24.981, p < .001; approximate 95% CI [.796, .932]), indicating that higher teacher ratings of transformational leadership were associated with higher ratings of the educational environment. The narrow difference between R² and adjusted R² indicates minimal model shrinkage within the analyzed sample.
Table 9: Simple-Regression Results for the Association Between Transformational Leadership and the Educational Environment
|
Predictor |
R |
R² |
Adj. R² |
F |
df |
p |
β |
Approx. 95% CI |
t |
|---|---|---|---|---|---|---|---|---|---|
|
Total TL score |
.864 |
.746 |
.745 |
624.059 |
1, 212 |
< .001 |
.864 |
[.796, .932] |
24.981 |
Note. Adjusted R² was derived from the reported sample size and model statistics. The source study described .864 as a regression coefficient but did not report the intercept, standard error, or unstandardized coefficient. Because this value is identical to R in a single-predictor regression model, it is reported as the standardized coefficient (β). The confidence interval was approximated from the reported β and t value; no unstandardized regression equation was reconstructed.
Because the study used cross-sectional data obtained from the same respondents through a single questionnaire, the findings indicate a strong predictive association and substantial shared variance rather than temporal precedence or causality. It therefore cannot be concluded that transformational leadership caused improvements in the educational environment.
3.4 Relative Contribution of Transformational-Leadership Dimensions
When the four transformational-leadership dimensions were entered simultaneously, the multiple-regression model was statistically significant, R = .867, R² = .752, adjusted R² ≈ .748, F(4, 209) = 158.691, p < .001. Collectively, the four dimensions explained approximately 75.2% of the variance in teachers’ assessments of the educational environment.
All four dimensions had positive and statistically significant standardized regression coefficients after controlling for the remaining dimensions. Intellectual stimulation demonstrated the largest relative contribution (β = .348, p < .001), followed by idealized influence (β = .256, p < .001), inspirational motivation (β = .216, p < .001), and individualized consideration (β = .180, p = .002). Thus, teachers’ perceptions of principals’ encouragement of critical thinking, innovation, and non-traditional problem-solving were most strongly associated with their assessments of the educational environment.
Table 10: Multiple-Regression Coefficients for Transformational-Leadership Dimensions
|
Predictor |
β |
Approx. SE |
Approx. 95% CI |
t |
p |
Tolerance |
VIF |
|---|---|---|---|---|---|---|---|
|
Intellectual stimulation |
.348 |
.049 |
[.252, .444] |
7.133 |
< .001 |
.497 |
2.012 |
|
Idealized influence |
.256 |
.054 |
[.149, .363] |
4.718 |
< .001 |
.401 |
2.492 |
|
Inspirational motivation |
.216 |
.056 |
[.105, .327] |
3.828 |
< .001 |
.371 |
2.694 |
|
Individualized consideration |
.180 |
.058 |
[.066, .294] |
3.119 |
.002 |
.355 |
2.821 |
Note. Model summary: R = .867, R² = .752, adjusted R² ≈ .748, F(4, 209) = 158.691, p < .001. The approximate standard errors and confidence intervals were derived from the reported standardized β and t values. Tolerance values ranged from .355 to .497, and VIF values ranged from 2.012 to 2.821, providing no indication of severe multicollinearity in the reported model. However, these statistics do not imply that the predictors were independent or free from conceptual overlap.
The standardized coefficients represent the relative association of each dimension with the educational environment while statistically controlling for the other dimensions; they should not be interpreted as separate percentages of explained variance or as causal effects. Because unstandardized coefficients, the regression intercept, raw data, and residual diagnostics were unavailable, an unstandardized prediction equation and a comprehensive assessment of model assumptions could not be reported.
3.5 Results for Research Question 4 and H02–H05: Demographic Differences
The source study examined demographic differences using the overall 55-item study-scale composite rather than reporting separate analyses for transformational leadership and the educational environment. Accordingly, the results presented in this section concern participants’ combined responses across the full instrument and cannot be attributed independently to either principal construct.
No statistically significant difference was found according to gender, t(212) = 1.770, p = .078. The estimated effect was small, Cohen’s d = .26, and the 95% confidence interval for the mean difference included zero [−.017, .316]. Therefore, H02 was not rejected.
Statistically significant differences were found according to age, F(3, 210) = 3.700, p = .013; academic qualification, F(2, 211) = 9.170, p < .001; and years of experience, F(3, 210) = 3.989, p = .009. The estimated effects were small for age (η² = .050; ω² = .036) and years of experience (η² = .054; ω² = .040), whereas academic qualification produced a moderate effect (η² = .080; ω² = .071). Accordingly, H03, H04, and H05 were rejected.
Table 11: Demographic Tests, Effect Sizes, and Hypothesis Decisions for the Overall Study-Scale Score
|
Variable |
Test statistic |
p |
Effect-size evidence |
Magnitude |
Decision |
|---|---|---|---|---|---|
|
Gender |
t(212) = 1.770 |
.078 |
d = .26; 95% CI for mean difference [−.017, .316] |
Small; not significant |
Retain H02 |
|
Age |
F(3, 210) = 3.700 |
.013 |
η² = .050; ω² = .036 |
Small |
Reject H03 |
|
Academic qualification |
F(2, 211) = 9.170 |
< .001 |
η² = .080; ω² = .071 |
Moderate |
Reject H04 |
|
Years of experience |
F(3, 210) = 3.989 |
.009 |
η² = .054; ω² = .040 |
Small |
Reject H05 |
Note. The two-tailed gender significance value (p = .078) was recalculated from t = 1.770 and df = 212 because the final column of the source table appeared to reproduce the significance value of Levene’s test (.505) rather than that of the independent-samples t test. Cohen’s d, the confidence interval for the gender mean difference, η², and ω² were derived from the reported group and ANOVA summaries. These derived estimates should be verified against the original SPSS dataset where available.
Scheffé post hoc comparisons showed that participants aged 50 years and above reported a significantly higher overall mean than those aged 40–49 years. Regarding academic qualification, participants holding a bachelor’s degree or a professional diploma reported higher means than those holding a master’s degree or above. For years of experience, participants with 5 to less than 10 years of experience reported a higher mean than those with 10 to less than 15 years of experience.
Table 12: Significant Scheffé Post Hoc Comparisons for the Overall Study-Scale Score
|
Variable |
Higher-mean group |
M |
Lower-mean group |
M |
Mean difference |
Direction |
|---|---|---|---|---|---|---|
|
Age |
50 years and above |
4.1711 |
40–49 years |
3.7360 |
.4351 |
50+ higher |
|
Academic qualification |
Bachelor’s degree |
3.98 |
Master’s degree and above |
3.39 |
.585 |
Bachelor’s higher |
|
Academic qualification |
Professional diploma |
3.93 |
Master’s degree and above |
3.39 |
.534 |
Diploma higher |
|
Years of experience |
5 to less than 10 years |
4.0638 |
10 to less than 15 years |
3.7540 |
.3098 |
5–<10 higher |
Note. Only pairwise comparisons reported as statistically significant in the source study are presented. Exact pairwise significance values and confidence intervals were unavailable. Because some demographic categories contained relatively small numbers of participants, particularly the master’s-degree-and-above and 50-years-and-above groups, the post hoc findings should be interpreted cautiously. Moreover, these differences relate to the overall study-scale composite and should not be interpreted as separate differences in transformational leadership or the educational environment.
4. Discussion
4.1 Transformational-Leadership Profile
The high overall mean for transformational leadership indicates that teachers generally perceived school principals as practicing its four dimensions at a substantial level. Inspirational motivation ranked first, suggesting that communicating a shared vision, encouraging teamwork, and mobilizing collective commitment constitute the most visible leadership practices in private secondary schools. This result is consistent with studies linking transformational leadership to collaborative school culture and teachers’ interpretation of institutional and technological change (Sasan et al., 2023; Laursen & Weiss, 2025).
The prominence of inspirational motivation may be particularly relevant in private schools, where leaders are expected to maintain staff commitment, respond rapidly to institutional demands, and sustain confidence in school goals. Nevertheless, the narrow differences among the four dimensions indicate a generally integrated leadership profile rather than a marked dominance of one dimension.
Individualized consideration ranked last, although it remained within the high level. This finding does not indicate an absence of professional support but reveals a relative imbalance between collective motivation and attention to individual teachers’ needs. The comparatively lower indicators relating to participation, recognition of achievements, and professional authority suggest that positive relationships are not always translated into differentiated mentoring, feedback, or influence in decision-making.
This interpretation aligns with evidence that psychological empowerment strengthens the contribution of transformational leadership to professional engagement (Khreiba et al., 2022). Sustainable transformational leadership therefore requires moving beyond general encouragement toward systematic coaching, individualized professional-development plans, constructive feedback, and meaningful participation in decisions affecting teachers’ work.
4.2 Educational-Environment Profile
The high overall educational-environment score reflects generally positive human and non-human conditions within the participating schools. The strongest indicators related to professional and social relationships, safety, role-model behavior, staff development, extracurricular activities, and communication with families. This pattern suggests that the schools possess a supportive relational climate capable of sustaining collaboration and professional commitment.
The slight advantage of human over non-human elements may indicate that schools compensate for limitations in physical or technological resources through interpersonal support and collective professional effort. Previous research has associated leadership support and recognition with a positive school climate and stronger teacher retention, while supportive learning environments have been linked to higher levels of students’ cognitive, behavioral, and emotional engagement (Ismail & David, 2024; Kassab et al., 2024).
Despite the positive overall evaluation, the lower-rated indicators reveal important developmental priorities. Limited authority and insufficient resources for teachers may constrain professional agency, even where morale and collegial relationships are strong. Similarly, the comparatively low ratings for digital-library provision and inclusive classroom design indicate that communication technologies may be more developed than instructional digital infrastructure and accessible learning environments.
Using social-media platforms to communicate with families represents an organizational strength, but it should not be regarded as equivalent to meaningful digital transformation in teaching and learning. A sustainable educational environment requires accessible digital resources, assistive technologies, inclusive classroom design, reliable infrastructure, and sufficient professional autonomy for teachers to implement and evaluate innovation.
4.3 Association and Relative Dimension Contributions
The strong positive association between transformational leadership and the educational environment indicates substantial overlap between teachers’ evaluations of leadership practices and school conditions. This relationship is theoretically plausible because the two constructs share organizational features such as vision, support, participation, communication, trust, safety, and innovation. Transformational leadership may help organize these conditions into a coherent school environment, while a supportive environment may facilitate and strengthen the visibility of transformational practices.
The direction of this relationship may therefore be reciprocal. Moreover, the cross-sectional design, reliance on the same respondents, use of a common response scale, and simultaneous measurement may have increased shared variance through common-method effects. The reported R² should consequently be interpreted as the proportion of statistical variance explained within the measured data, rather than as the percentage of actual educational-environment improvement caused by transformational leadership.
Intellectual stimulation produced the largest unique standardized coefficient, although inspirational motivation obtained the highest descriptive mean. This distinction is important. Inspirational motivation may be the most frequently perceived practice, but its explanatory contribution may overlap with other leadership dimensions. Intellectual stimulation appears to provide more distinctive explanatory value by promoting critical reflection, experimentation, self-evaluation, and non-traditional approaches to solving school problems.
This result is consistent with the emphasis placed on intellectual stimulation and inspirational motivation in leading creative professionals (Uusi-Kakkuri, 2017). It suggests that improving the educational environment requires more than enthusiasm and shared vision; it also requires organizational routines that transform ideas into inquiry, collaborative problem-solving, experimentation, and systematic evaluation.
Idealized influence ranked second in relative contribution, indicating that innovation and change are more likely to be accepted when leadership is grounded in credibility, ethical conduct, consistency, and trust. Inspirational motivation and individualized consideration also retained significant unique contributions. The four dimensions should therefore be understood as complementary rather than competing components of transformational leadership.
Innovation without trust may increase professional uncertainty, vision without participation may produce compliance rather than commitment, and collective motivation without individualized support may neglect differences in teachers’ capacities and professional circumstances. Balanced leadership development should therefore integrate ethical influence, shared purpose, intellectual stimulation, and personalized professional support.
4.4 Demographic Differences
The absence of a statistically significant gender difference, combined with the small effect size, indicates that male and female teachers held broadly similar perceptions of the overall study-scale constructs. This finding suggests that the measured leadership and environmental conditions were experienced relatively consistently across gender groups.
The significant differences associated with age and experience followed non-linear patterns. Participants aged 50 years and above reported more positive perceptions than those aged 40–49 years, whereas teachers with five to less than ten years of experience reported higher means than those with ten to less than fifteen years. These differences may reflect variation in professional expectations, workload, career-stage pressures, accumulated institutional comparisons, promotion opportunities, or perceived recognition.
However, age and professional experience are conceptually and statistically related, and the source analysis examined them separately. Their effects should therefore not be interpreted as independent or causal. The small effect sizes further indicate that these variables explained only a limited proportion of differences in overall responses.
Academic qualification produced the largest demographic effect. Teachers holding bachelor’s degrees or professional diplomas reported more positive overall perceptions than those holding master’s degrees or above. One possible interpretation is that advanced academic study increases expectations regarding participatory governance, research-informed planning, professional autonomy, and digital and pedagogical innovation.
This interpretation remains tentative because the master’s-degree-and-above category included only 18 participants and the demographic analysis was conducted on the combined 55-item scale. The result therefore identifies a perception gap between qualification groups but does not demonstrate that advanced qualifications directly produce less favorable attitudes.
4.5 Methodological and Interpretive Limitations
Several limitations define the evidential boundaries of the study. First, its cross-sectional design prevents conclusions regarding temporal sequence or causality. Second, leadership and educational-environment data were obtained from the same teachers using a single questionnaire, increasing the possibility of common-method variance and socially desirable responding.
Third, the number and identities of participating schools were not reported. Teachers were therefore likely clustered within schools, but intraclass correlations, cluster-adjusted standard errors, and multilevel analyses could not be calculated. The operational sampling frame, invitation procedures, replacement process, and response rate were also insufficiently documented, limiting evaluation of sample representativeness.
Fourth, validity evidence was restricted to specialist review and correlation-based indicators. No exploratory or confirmatory factor analysis, convergent validity, discriminant validity, or measurement-invariance testing was reported. Although the reliability coefficients were high, the full-scale alpha of .971 may reflect both strong internal consistency and possible item redundancy; it should not be interpreted as evidence of unidimensionality.
Fifth, the source study did not report diagnostic evidence concerning linearity, residual normality, homoscedasticity, independence of errors, influential observations, or outliers. Although the reported collinearity indicators did not suggest severe multicollinearity, the absence of complete diagnostics limits evaluation of the regression assumptions.
Sixth, demographic differences were tested using the overall 55-item composite rather than separate transformational-leadership and educational-environment scores. Consequently, the observed differences cannot be attributed independently to either construct. Finally, the available documentation did not include complete information concerning ethical approval, informed consent, confidentiality, withdrawal rights, or data-retention procedures.
These limitations do not invalidate the observed statistical patterns, but they require cautious interpretation. They also identify priorities for future research, including longitudinal and multilevel designs, independent sources of measurement, separate construct-level demographic analyses, stronger validation procedures, complete regression diagnostics, and transparent reporting of sampling and ethical procedures.
5. Conclusion and Recommendations
5.1 Conclusion
The study indicates that teachers in private secondary schools in Bethlehem Governorate perceive both transformational leadership and the educational environment at high levels. Inspirational motivation emerged as the most prominent leadership dimension, followed by intellectual stimulation, whereas individualized consideration ranked comparatively lowest despite remaining within the high category. This pattern suggests that principals are relatively effective in articulating shared purpose and mobilizing collective effort, but greater attention is needed to individualized mentoring, differentiated support, and teachers’ participation in professional decision-making.
The educational environment was also rated highly, with human elements slightly exceeding non-human elements. Positive interpersonal relationships, safety, professional cooperation, extracurricular activities, and school–family communication constituted notable strengths. However, teacher authority, digital-resource provision, inclusive classroom design, and the infrastructure required to support innovation remained comparatively less developed.
Transformational leadership was strongly associated with the educational environment, and each of its four dimensions made a positive and statistically significant unique contribution when examined simultaneously. Intellectual stimulation produced the largest standardized contribution, indicating that teachers’ perceptions of the educational environment are particularly associated with principals’ capacity to encourage critical inquiry, experimentation, reflection, and non-traditional problem-solving.
These findings support the importance of a balanced transformational-leadership profile integrating ethical influence, shared vision, intellectual stimulation, and individualized professional support. Nevertheless, because the study was cross-sectional and relied on teachers’ self-reports collected through a single instrument, the results demonstrate strong statistical association rather than temporal or causal influence. The principal practical conclusion is therefore that transformational-leadership practices are closely intertwined with teachers’ perceptions of the human, organizational, technological, and material conditions of their schools
5.2 Practical Recommendations
-
Develop a competency-based leadership-development program for private-school principals covering all four transformational-leadership dimensions, with particular emphasis on individualized consideration, active listening, professional coaching, constructive feedback, and personalized development planning.
-
Translate inspirational motivation into participatory governance by involving teachers in setting school goals, designing improvement plans, evaluating institutional initiatives, and participating in decision-making and innovation committees.
-
Institutionalize intellectual stimulation through professional learning communities, action research, lesson study, problem-solving teams, and protected time for testing and evaluating innovative instructional and organizational practices.
-
Support innovation by granting teachers appropriate professional authority, time, resources, technical assistance, and organizational flexibility rather than relying solely on verbal encouragement or general motivation.
-
Increase investment in digital libraries, reliable educational technologies, assistive technologies, advanced classroom equipment, and inclusive physical designs responsive to the needs of all students, including students with disabilities.
-
Establish differentiated professional-support pathways, including structured induction for novice teachers, renewal and advancement opportunities for mid-career teachers, and mentoring and strategic leadership roles for highly experienced teachers.
-
Engage teachers holding master’s degrees or higher qualifications in institutional research, school self-evaluation, curriculum development, policy review, and evidence-informed planning so that their advanced expertise contributes directly to school improvement.
-
Strengthen school–family–community partnerships beyond routine social-media communication through structured consultation, joint educational programs, and partnerships with universities, civil-society organizations, and relevant educational institutions.
-
Introduce an annual educational-environment dashboard incorporating measurable indicators of teacher participation, professional empowerment, psychological safety, digital access, inclusion, facilities, curricular support, professional growth, and extracurricular opportunities.
-
Use the dashboard results to formulate time-bound improvement plans, assign institutional responsibilities, allocate resources, and evaluate progress periodically rather than relying exclusively on general perceptions of school quality.
5.3 Recommendations for Future Research and Reporting
-
Replicate the study with longitudinal or quasi-experimental designs and multiple data sources, including teachers, principals, students, observations, and objective school indicators.
2. Record school identifiers and apply multilevel modeling or cluster-robust analysis to distinguish teacher-level from school-level effects.
3. Validate the instrument through exploratory and confirmatory factor analysis and assess convergent, discriminant, and criterion validity.
4. Report unstandardized regression coefficients, confidence intervals, diagnostic tests, missing-data procedures, effect sizes, and separate demographic analyses for each principal construct.
5. Document the sampling frame, invitations, response rate, ethics approval, informed consent, anonymity, and data-governance procedures in accordance with journal requirements.
6. Compare private and public schools and examine mediators or moderators such as psychological empowerment, job satisfaction, burnout, school climate, and resource adequacy.
References
Note. Arabic-language sources are presented with English-translated titles as supplied in the study record.
Abdel Qader, Z. (2024). Transformational leadership among school principals in Arab communities inside the Green Line and its relationship to the availability of education quality standards and job satisfaction (Doctoral dissertation). An-Najah National University.
Abu Aldibs, I. (2024). The role of school principals in providing a safe school environment from the teachers’ perspective (Unpublished master’s thesis). Hebron University.
Al-Khataybeh, S. (2022). Transformational leadership among private school principals and its relationship to crisis management from teachers’ perspective in Wadi Al-Seer District, Amman (Unpublished master’s thesis). Middle East University.
Bass, B. M. (1985). Leadership and performance beyond expectations. New York, NY: Free Press.
Burns, J. M. (1978). Leadership. New York, NY: Harper & Row.
Heinz, M., Graham, L., & Maulana, R. (2025). Towards more equitable and inclusive learning environments: Forging new connections and research directions. Learning Environments Research, 28, 189–199. doi:10.1007/s10984-025-09553-0
Ismail, S., & David, S. (2024). The impact of school leadership support on teacher retention: A study among school leaders and teachers. International Journal of Educational Administration and Leadership: Theory and Practice, 3(1), 1–15.
Kassab, S. E., Rathan, R., Taylor, D. C. M., & Hamdy, H. (2024). The impact of the educational environment on student engagement and academic performance in health professions education. BMC Medical Education, 24, 1278. doi:10.1186/s12909-024-06270-9
Khreiba, M. S. M., Enas, S., & Abu Al-Hasan, A. S. M. (2022). The mediating role of psychological empowerment in the relationship between transformational leadership and job engagement among faculty members and their assistants at the Faculties of Education, Zagazig University. Educational Journal of the Faculty of Education, Sohag University, 93(93), 49–142. doi:10.21608/edusohag.2022.211280
Krejcie, R. V., & Morgan, D. W. (1970). Determining sample size for research activities. Educational and Psychological Measurement, 30, 607–610. doi:10.1177/001316447003000308
Laursen, R., & Weiss, F. (2025). The role of school leaders’ transformational leadership practices and sense-making during the implementation of new technology: The case of the mandatory introduction of a learning management system in Danish schools. Leadership and Policy in Schools. Advance online publication. doi:10.1080/15700763.2025.2482160
Ministry of Education and Higher Education–Palestine. (2022). Annual educational report. Ramallah, Palestine: Author.
Saleh, D., & Al-Mubaideen, M. (2023). The role of transformational leadership in improving school administration performance in Jordan. Ibn Khaldun Journal for Studies and Research, 2(7), 572–593.
Sasan, J., Escultor, G., & Larsari, V. (2023). The impact of transformational leadership on school culture. International Journal of Social Service and Research, 3(8), 1899–1907.
Sianipar, A., & Putri, A. Y. (2024). The role of transformational leadership in improving school performance: A systematic literature review. International Journal of Research and Innovation in Social Science, 8(12), 1403–1415. doi:10.47772/IJRISS.2024.8120119
Uusi-Kakkuri, P. (2017). Transformational leadership and leading creativity (Acta Wasaensia No. 376). Vaasa, Finland: University of Vaasa.
 Arabic
  English