
GIS-Based Site Selection for Fitness Centers: A Case Study in Riyadh City
اختيار مواقع مراكز اللياقة البدنية باستخدام نظم المعلومات الجغرافية: دراسة حالة في مدينة الرياض
Omar Mukren Al Shabrami1, Sameer Alwattar1
1 Real Estate Development Program, Department of Urban Planning, College of Architecture and Planning, King Saud University, KSA
Emails: 445107683@student.ksu.edu.sa, swattar@ksu.edu.sa
DOI: https://doi.org/10.53796/hnsj77/8
Arabic Scientific Research Identifier: https://arsri.org/10000/77/8
Volume (7) Issue (7). Pages: 126 - 142
Received at: 2026-06-05 | Accepted at: 2026-06-15 | Published at: 2026-07-01
Abstract: Rapid urban growth and subjective planning methods in Riyadh City have led to spatial disparities and market overload for fitness facilities. No deterministic, data-driven Spatial Decision Support System currently exists to guide fitness center site selection in Riyadh; planning decisions remain dependent on subjective market observation, producing spatial inequity and localized market saturation. To address this gap, this study develops a Geographic Information Systems (GIS)-based Spatial Decision Support System for the optimal siting of fitness centers within the administrative boundary of Riyadh City. The research combines the Analytic Hierarchy Process (AHP) with network-oriented Location-Allocation modeling to assess district-level demographic demand, network accessibility, and competitor proximity. The AHP procedure produced weights of 54% (Accessibility), 26% (Population Density), and 20% (Competitor Proximity), with a Consistency Ratio of 0.0158 — well within Saaty's acceptable threshold. Baseline assessments across all 273 existing fitness facilities indicated notable market inefficiencies, with a mean composite suitability of 7.50 (SD = 0.94), alongside substantial gender-related deficiencies in provision. The Location-Allocation optimization subsequently identified nine high-potential candidate locations across underserved districts, with a markedly higher mean composite suitability score of 8.31 (SD = 0.53). This framework offers a transferable spatial planning instrument for urban planners and private investors to mitigate capital risk, address land-use restrictions, and advance the equitable urban health objectives of Saudi Vision 2030.
Keywords: Geographic Information Systems; Analytic Hierarchy Process; Location-Allocation; Spatial Decision Support System; Riyadh City.
المستخلص: أدى النمو العمراني المتسارع ومنهجيات التخطيط التقديرية في مدينة الرياض إلى اختلالات مكانية وتشبع محلي في سوق مراكز اللياقة البدنية. وفي ظل غياب نظام محكم ومبني على البيانات لتوجيه اختيار المواقع، تظل القرارات رهنًا بالملاحظات السوقية الذاتية، مما يتسبب في غياب العدالة المكانية.ولسد هذه الفجوة، طوّرت هذه الدراسة نظامًا لدعم القرار المكاني يعتمد على نظم المعلومات الجغرافية (GIS) لتحديد المواقع المثلى لمراكز اللياقة البدنية في الرياض. يدمج البحث بين "عملية التسلسل الهرمي التحليلي" (AHP) ونموذج "التخصيص والموقع" لتقييم الطلب السكاني، وسهولة الوصول عبر الشبكات، والقرب من المنافسين.خلصت عملية (AHP) إلى تحديد أوزان نسبية بلغت 54% لسهولة الوصول، و26% للكثافة السكانية، و20% للقرب من المنافسين، بنسبة اتساق بلغت 0.0158 (ضمن النطاق المقبول). وأظهر تقييم الوضع الراهن قصورًا ملحوظًا في كفاءة السوق؛ حيث سجلت المرافق الحالية متوسطاً بلغ 7.50، مع وجود عجز جوهري في توفير الخدمات لبعض الفئات. في المقابل، حدد نموذج تحسين "التخصيص والموقع" تسعة مواقع مرشحة ذات إمكانات عالية في الأحياء التي تفتقر للخدمات، محققةً متوسط ملاءمة مركب أعلى بكثير بلغ 8.31. يقدم هذا الإطار أداة تخطيط مكاني قابلة للتطبيق لمخططي المدن والمستثمرين لتقليل المخاطر الرأسمالية، وتجاوز قيود استخدامات الأراضي، وتعزيز مستهدفات الصحة الحضرية العادلة لرؤية السعودية 2030.
الكلمات المفتاحية: نظم المعلومات الجغرافية؛ عملية التسلسل الهرمي التحليلي؛ التخصيص والموقع؛ نظام دعم القرار المكاني؛ مدينة الرياض.
1. Introduction
The strategic allocation of land use is a fundamental requirement for sustainable urban development, particularly in metropolitan regions where spatial decisions dictate accessibility and environmental quality (Topuz & Deniz, 2023). Location-specific attributes such as proximity to transportation networks, population density, and physical characteristics are primary determinants of land suitability (Topuz & Deniz, 2023), and the complexity of selecting optimal sites has intensified as cities densify (Aboulola et al., 2021). Without high-resolution analytical frameworks, urban expansion often relies on coarse-grain data, leading to inefficiencies and spatial disparities in service provision.
Geographic Information Systems (GIS) provide the necessary capabilities for spatial decision-making by managing and visualizing large datasets (Bopche & Neware, 2020; Ismael & Bashir, 2014). GIS-based analyses allow planners and investors to evaluate land use options by integrating conflicting criteria, supporting zoning, equity assessment, public infrastructure prioritization, and market viability analysis under the same spatial framework (Topuz & Deniz, 2023). Within Location Theory, the optimal placement of a service facility is a function of minimizing transport costs while maximizing market accessibility and accounting for strategic customer behavior regarding congestion (Dubé et al., 2016; Jalili Marand & Hoseinpour, 2024). The integration of Multi-Criteria Decision-Making (MCDM) with GIS — and specifically the Analytic Hierarchy Process (AHP) — is required to identify locations that maximize accessibility and support spatial equity goals (Abdollahi et al., 2024).
In Saudi Arabia, these planning challenges are framed by the Quality-of-Life Program Delivery Plan 2021–2025, which prioritizes “development and enriching of lifestyle” under Saudi Vision 2030 (Kingdom of Saudi Arabia, 2016; Quality-of-Life Program, 2021). The Program establishes a quantitative target to raise weekly sports participation from a 2019 baseline of 19% to 40% by 2030 and to increase the sports sector’s contribution to GDP to 1.0% by 2030 (Quality-of-Life Program, 2021). Realization of these targets relies heavily on private-sector engagement, yet investors face “difficulty of investment” due to a lack of data-driven insights (Quality-of-Life Program, 2021).
1.1. Research Problem
In rapidly urbanizing contexts, planning authorities frequently lack systematic, data-driven tools, relying instead on “random or subjective” assessments that fail to account for multidimensional socio-economic variables (Ismael & Bashir, 2014). This methodological deficiency leads to inefficient infrastructure investments, severe market cannibalization, and significant land-use conflicts (Aboulola et al., 2021; Topuz & Deniz, 2023). In Riyadh specifically, the Quality-of-Life Program identifies “limited spaces to practice sports” and a “scarcity of elite sports training centers” as primary obstacles, with “limited choices for women” as a major structural barrier (Quality-of-Life Program, 2021). The absence of an institutionalized Spatial Decision Support System (SDSS) creates uncertainty for investors and limits planning authorities’ capacity to direct development toward underserved zones.
The core research problem, therefore, is the absence of a deterministic, data-driven SDSS to guide fitness center site selection in Riyadh — resulting in spatial inequity and localized market congestion. Addressing this problem requires developing a GIS-based suitability model capable of systematically identifying high-demand, low-competition locations (Jalili Marand & Hoseinpour, 2024).
1.2. Research Objectives
The main objective is to construct a GIS-based Spatial Decision Support System for siting fitness centers in Riyadh, aligned with Saudi Vision 2030. Three sub-objectives follow:
- To assess and rank the spatial factors influencing land suitability for fitness centers through the Analytic Hierarchy Process (AHP).
- To evaluate the baseline distribution of current fitness centers through Network Analysis, measuring present service deficiencies and localized market saturation.
- To optimize the spatial arrangement of future fitness centers using a Location-Allocation model that maximizes demographic reach and addresses identified infrastructure gaps.
1.3. Research Limitations
The spatial scope is restricted to the administrative boundary of Riyadh City, operating at district-level granularity — the operational ceiling of General Authority for Statistics (GASTAT) data, which provides population totals at the district level without sub-district disaggregation. The temporal scope is centered on the year 2026, employing the latest available geospatial datasets to capture recent urban growth and demographic change. The AHP pairwise comparisons were performed by the researcher and grounded in the empirical consensus established in the literature, rather than through independent expert elicitation or a Delphi panel; this literature-anchored AHP variant is methodologically transparent but introduces a subjectivity boundary that is explicitly acknowledged.
1.4. Theoretical Framework
The study integrates three complementary theoretical pillars. (i) The Congested Facility Location Problem (CFLP), formalized by Jalili Marand and Hoseinpour (2024), holds that strategic customers anticipate delays at overcrowded facilities and may rationally choose a slightly more distant, less-congested facility — making consumer behavior a function of both distance and congestion, not distance alone. This mandates the joint modeling of population demand and competitor saturation. (ii) Localized Market Potential Theory (Dubé et al., 2016) argues that location viability is most effectively assessed at granular spatial scales — the district or sub-district — rather than at the level of the metropolitan region, justifying the disaggregation of Riyadh into administrative districts. (iii) GIS-based Multi-Criteria Decision Analysis, operationalized through AHP (Saaty, 1980), provides the structured mathematical apparatus translating qualitative theoretical positions into quantitative spatial priorities, validated through the Consistency Ratio test (Ponsiglione et al., 2022).
2. Methodology
The research employs a spatially explicit, hybrid Multi-Criteria Decision Analysis (MCDA) framework, integrating GIS with a structured multi-criteria weighting process. The framework is designed to resolve the CFLP by transitioning from subjective planning to a deterministic, data-driven decision architecture. Implementation proceeds through a four-phase spatial workflow: (i) data acquisition and network initialization; (ii) AHP-based criterion weighting and consistency validation; (iii) multi-criteria suitability modeling through Weighted Overlay; and (iv) prescriptive Location-Allocation optimization (see Figure 1).

Figure (1) Case study process flowchart.
Source: Prepared by the author.
2.1. Data Collection and Preparation
The spatial database was constructed using a hybrid data approach (Aboulola et al., 2021). District-level population counts were acquired from GASTAT (Table 1). Satellite imagery from Google Earth Pro was used as a reference layer to validate the geometric accuracy of the base map (Balakrishnan, 2019). Demographic demand was represented using district-level population centroids generated via the ArcGIS “Feature to Point” tool; each centroid was assigned the corresponding district’s total population as a demand weight. Tabular census records were geometrically joined to the Riyadh district polygon layer, establishing the demographic baseline for subsequent analysis. The existing operational gym distribution constituting the analytical baseline is presented in Figure 2; the imbalance in facility provision across districts is summarized in Table 2.
| Table (1) Attribute table — district-level demographic dataset imported from GASTAT. | |||
| City | District Name | Gender | Age Group |
| Riyadh | Al Rawdah | Male | 15-64 |
| Riyadh | Al Rawdah | Female | 15-64 |
Source: Prepared by the author based on GASTAT (2022).
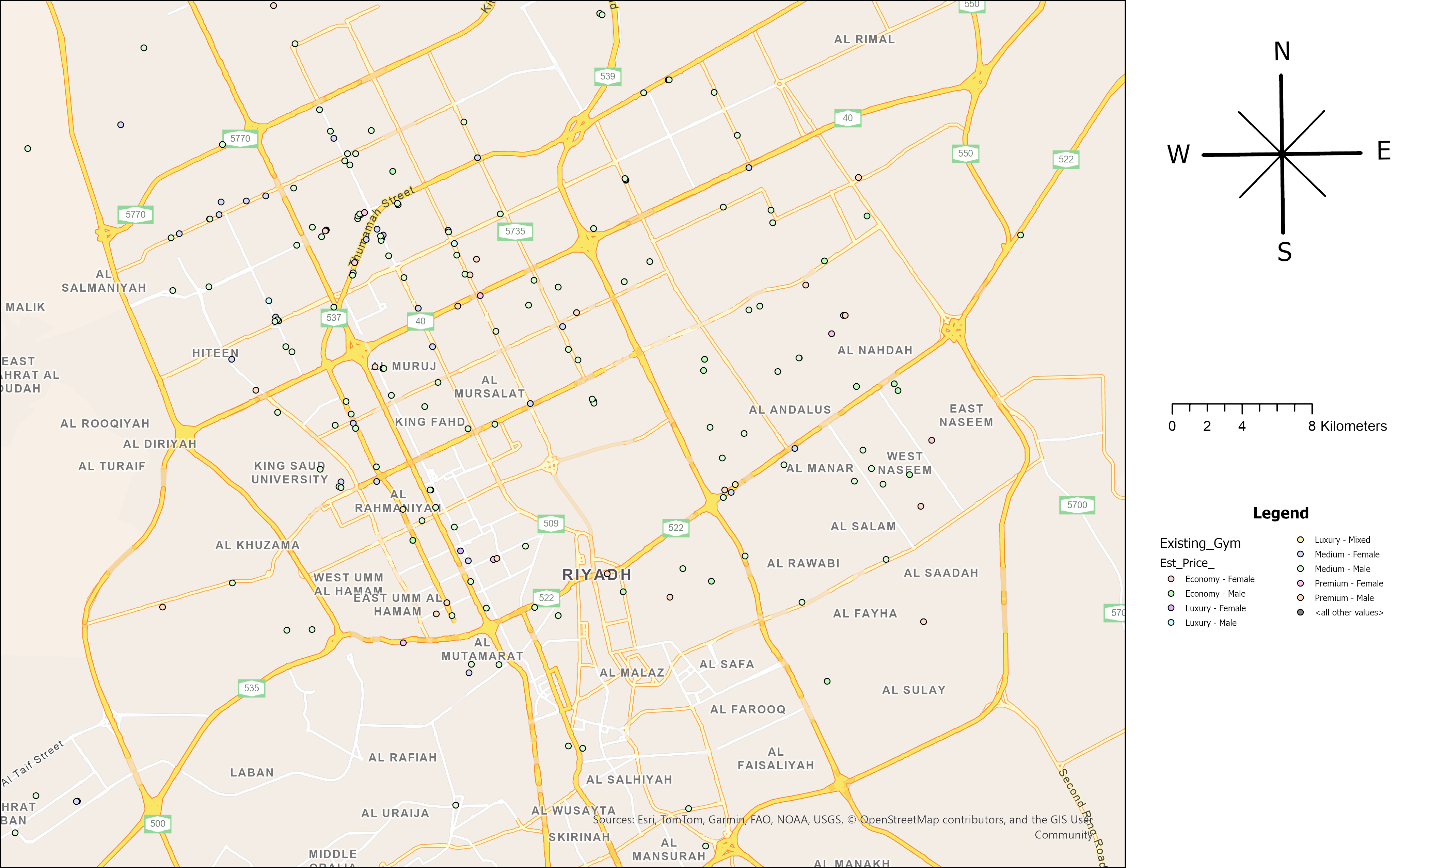
Figure (2) Existing gym distribution across Riyadh City.
Source: Prepared by the author using Google Earth Pro & ArcGIS Pro.
| Table (2) Sample of gym counts and population by district. | ||
| Gym Count | Population | District |
| 15 | 27,482 | Al-Rabee neighborhood |
| 13 | 40,422 | Al Sahafa District |
| 6 | 81,479 | Al Rawdah neighborhood |
| 6 | 31,937 | Al-Muruj neighborhood |
| 1 | 21,361 | Al-Nuzha neighborhood |
| 1 | 35,822 | Al Salam neighborhood |
| 0 | 17,073 | Al-Ghadir neighborhood |
| 0 | 41,745 | Al Hamra neighborhood |
| 0 | 17,066 | Al-Mursalat neighborhood |
Source: Prepared by the author based on spatial analysis.
Table 2 reveals a clear imbalance: some districts host a high concentration of gyms, while many high-population districts have none. This uneven distribution suggests that facility placement has been driven by market opportunism rather than a systematic, demand-led planning framework — consistent with the core research problem.
2.2. Implementation of the Analytic Hierarchy Process (AHP)
The AHP was implemented using pairwise comparisons on Saaty’s fundamental 1–9 scale to assess the relative importance of the three suitability criteria. The pairwise judgments were performed by the researcher, with each value derived from the literature consensus rather than from independent expert elicitation — referred to as literature-anchored AHP. Accessibility was judged between equally and moderately more important than Population Density (value: 2) and moderately more important than Competitor Proximity (value: 3), grounded in the empirical finding by Jiang et al. (2022) that network-based proximity is the primary determinant of fitness facility uptake, and corroborated by Qwaider et al. (2023) in the Riyadh context. Population Density and Competitor Proximity were judged of equal importance (value: 1), as both represent demand–supply constraints operating at the same spatial scale within the CFLP framework (Jalili Marand & Hoseinpour, 2024). The pairwise comparison matrix is presented in Table 3.
| Table (3) AHP pairwise comparison matrix for suitability criteria weighting. | |||
| Criterion | Accessibility | Population Density | Competitor Proximity |
| Accessibility | 1 | 2 | 3 |
| Population Density | 1/2 | 1 | 1 |
| Competitor Proximity | 1/3 | 1 | 1 |
| CR = 0.0158 | — | — | — |
Source: Prepared by the author.
The resulting priority vector yielded weights of 54% (Accessibility), 26% (Population Density), and 20% (Competitor Proximity), implemented directly in the ArcGIS Weighted Overlay tool. The Consistency Ratio (CR = 0.0158) confirmed that the pairwise judgments were internally consistent, falling well within Saaty’s acceptable threshold of CR < 0.10 (Ponsiglione et al., 2022).
2.3. Spatial Baseline and Service Area Sensitivity
The road network dataset for Riyadh was integrated with the point-feature layer representing existing fitness facilities, establishing the geometric and topological backbone of the model and enabling the transition from Euclidean distance to realistic, impedance-based travel costs (Figure 3). The Network Analyst extension was used to generate overlapping drive-time polygons at intervals of 0–3, 3–7, 7–10, 10–15, and 15–20 minutes outward from existing gym locations (Figure 4). Following visual inspection across all five thresholds, the 10-minute drive-time was selected as the optimal catchment boundary: at 3 and 5 minutes, service areas failed to achieve meaningful spatial continuity across Riyadh’s dispersed residential fabric; at 15 and 20 minutes, service areas overlapped to the point of obscuring meaningful differentiation between catchments and inflating apparent coverage. The 10-minute threshold produced the most spatially coherent and non-redundant coverage pattern, consistent with drive-time benchmarks adopted in comparable studies (Jiang et al., 2022; Qwaider et al., 2023).
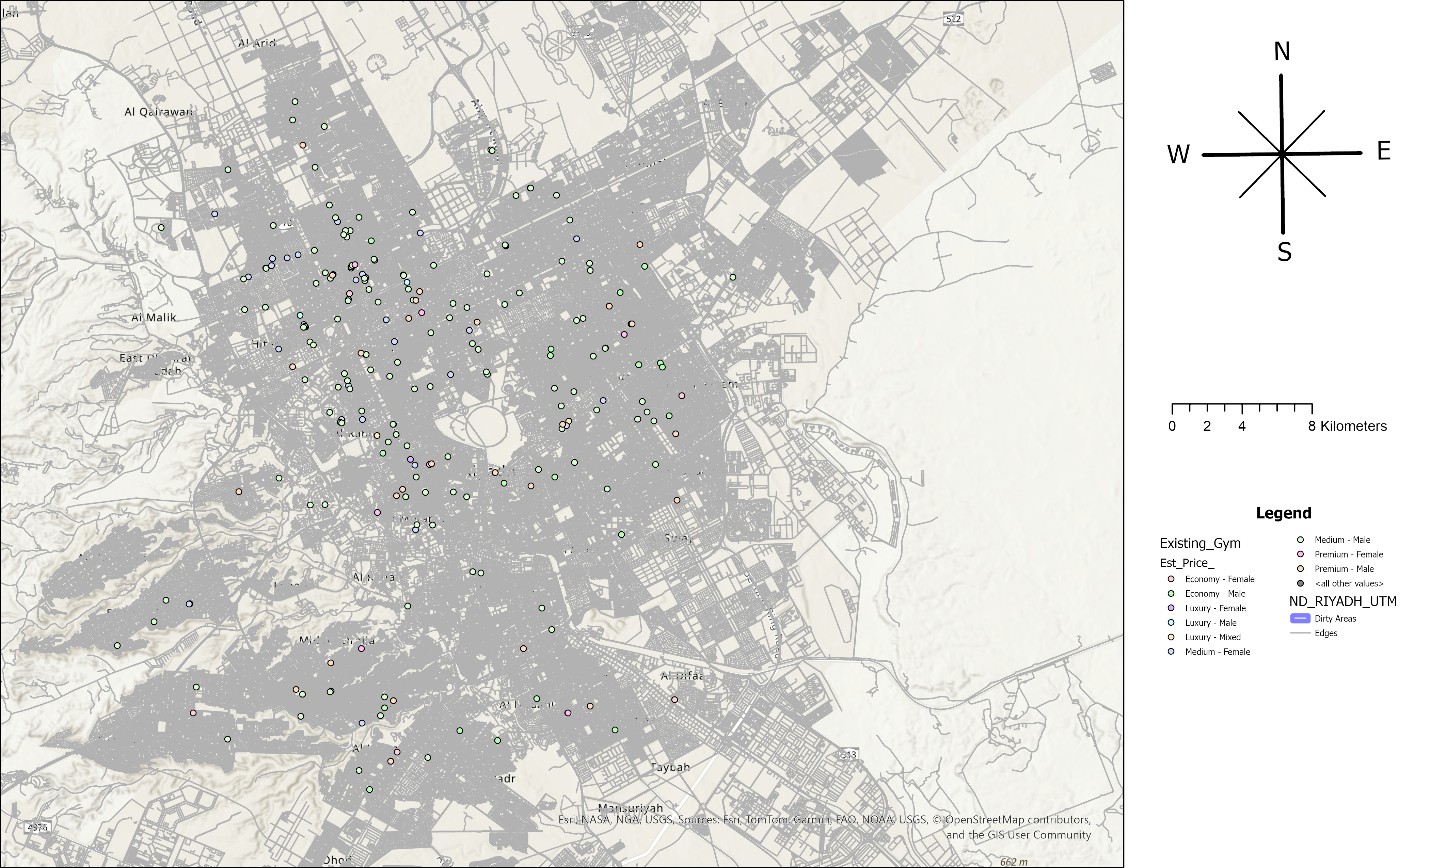
Figure (3) Network dataset including the existing gym distribution in Riyadh City.
Source: Prepared by the author using ArcGIS Pro.
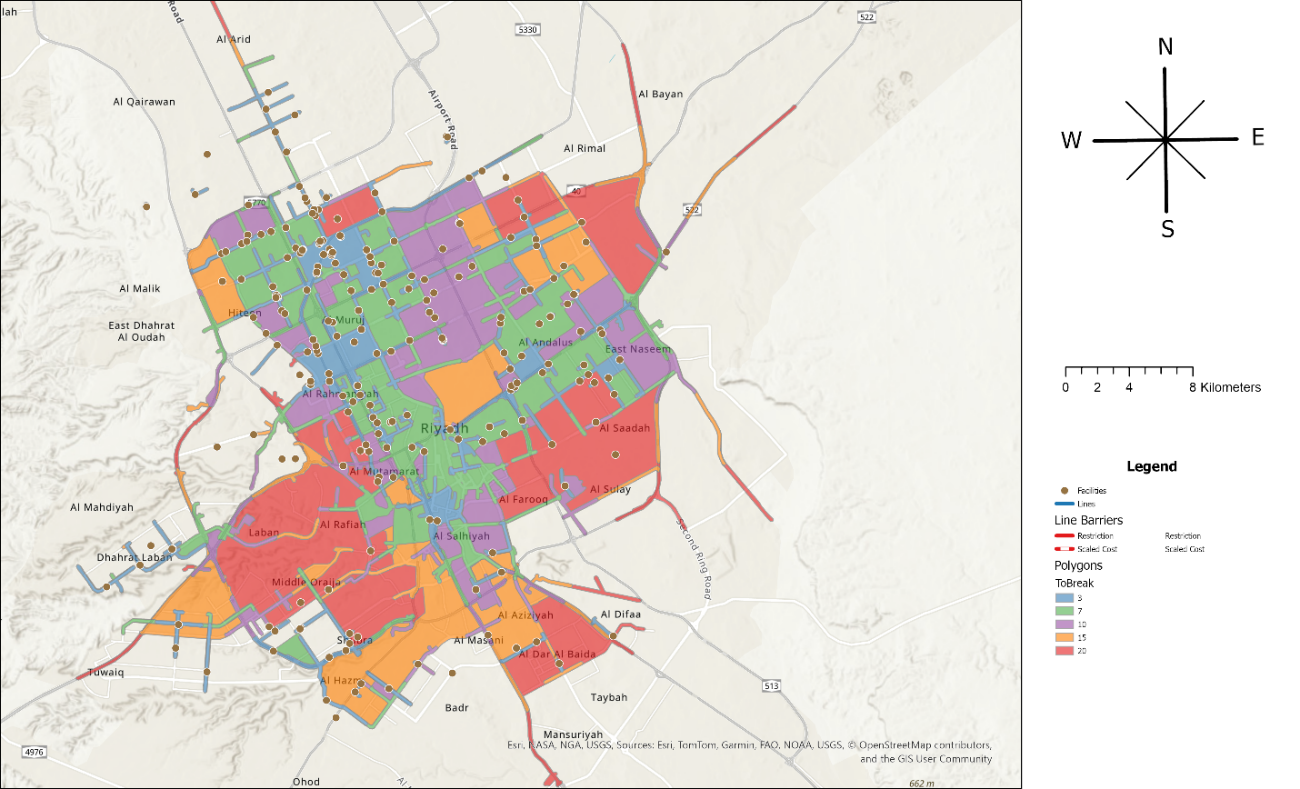
Figure (4) Service area coverage at 3, 5, 10, 15, and 20 minutes.
Source: Prepared by the author using ArcGIS Pro.
2.4. Multi-Criteria Suitability Modeling
Three continuous raster surfaces were generated, one per AHP criterion. (i) Competitor saturation was modeled via Kernel Density on the existing facility points, producing a continuous surface where darker, tightly clustered zones quantify localized market congestion and lighter zones represent cold spots with low competitive friction (Figure 5). (ii) Demographic demand was represented through a district-level choropleth density map — raw counts normalized by district area — where high-value zones identify primary traffic generators (Figure 5). (iii) Network accessibility was operationalized as a travel-time surface, with the urban landscape classified into temporal accessibility intervals (0–3, 3–7, 7–10, 10–15, and 15–20 minutes) based on road hierarchy and impedance (Figure 7).
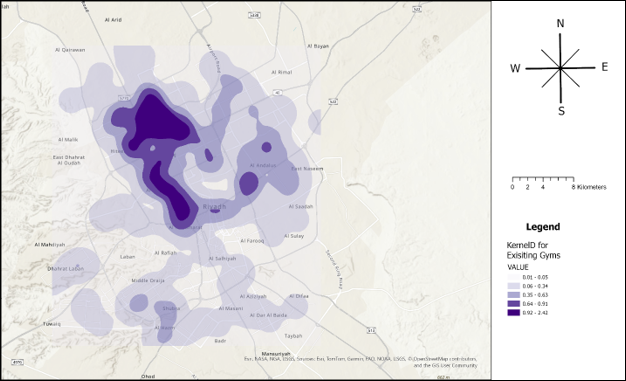
Figure (5) Kernel Density surface of existing gym facilities showing spatial competitor concentration.
Source: Prepared by the author using ArcGIS Pro.
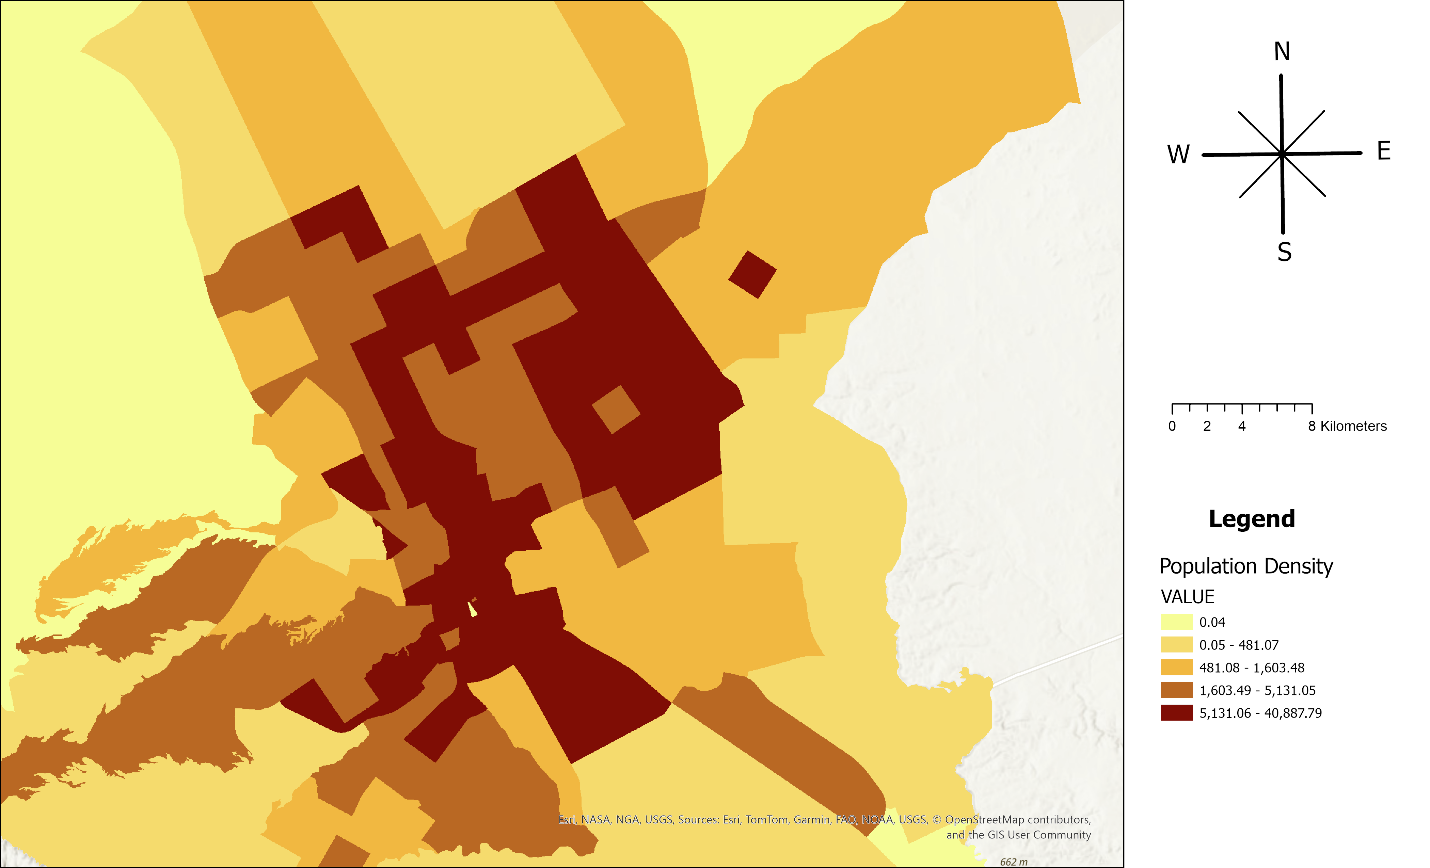
Figure (6) Population density per district in Riyadh City.
Source: Prepared by the author using ArcGIS Pro.
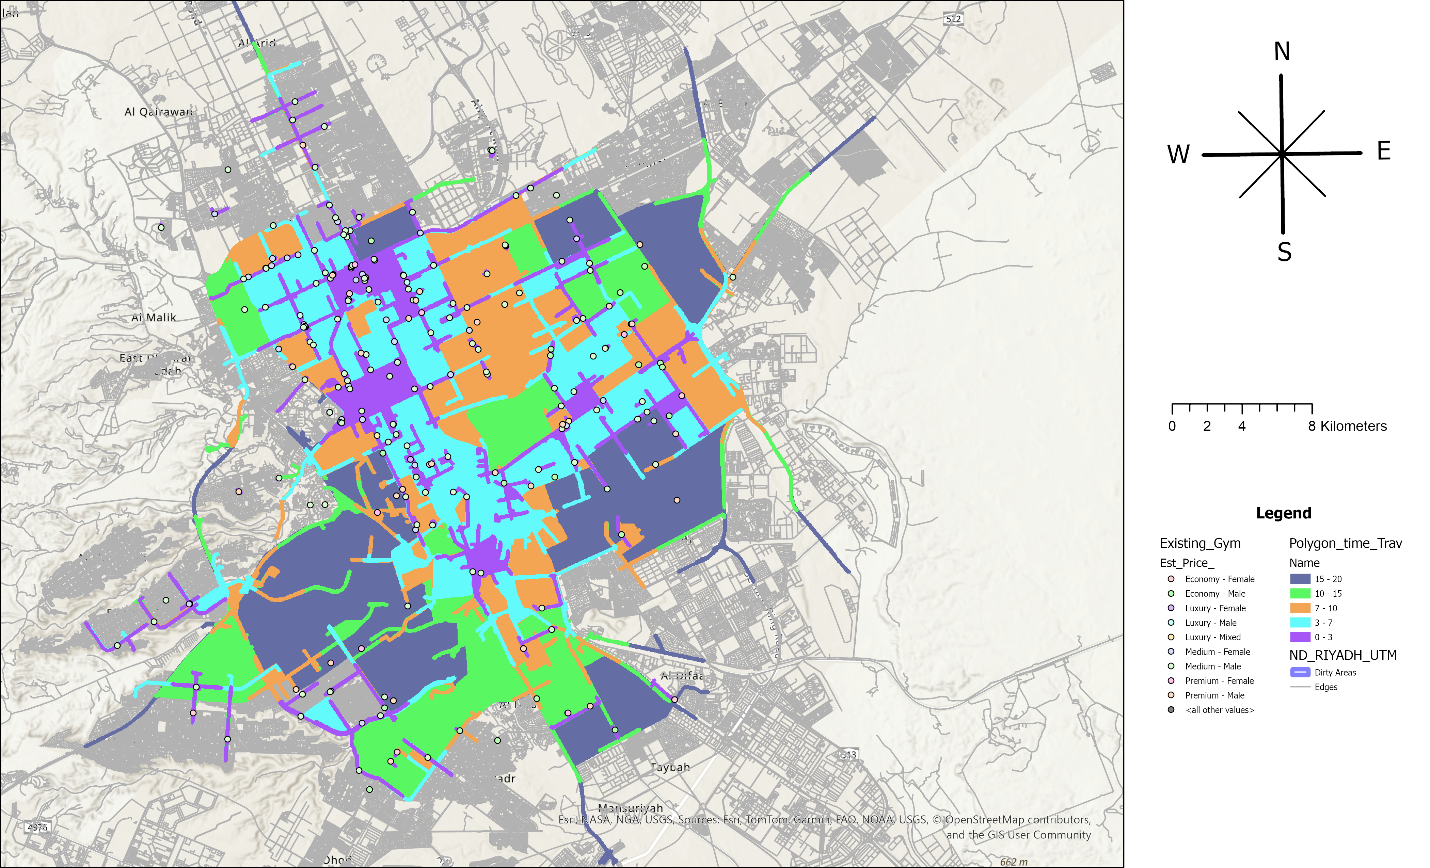
Figure (7) Network accessibility (travel-time surface).
Source: Prepared by the author using ArcGIS Pro.
All three parameter rasters were reclassified onto a standardized 1–10 scale to ensure mathematical compatibility, then synthesized through the ArcGIS Weighted Overlay tool with the AHP weights of 54%, 26%, and 20% respectively. The algorithm multiplies each pixel’s standardized value by its corresponding criterion weight to generate a continuous composite suitability raster (Figure 8). The highest-scoring pixels (≥ 8) were extracted and converted into point features to serve as the candidate sites for the Location-Allocation phase.
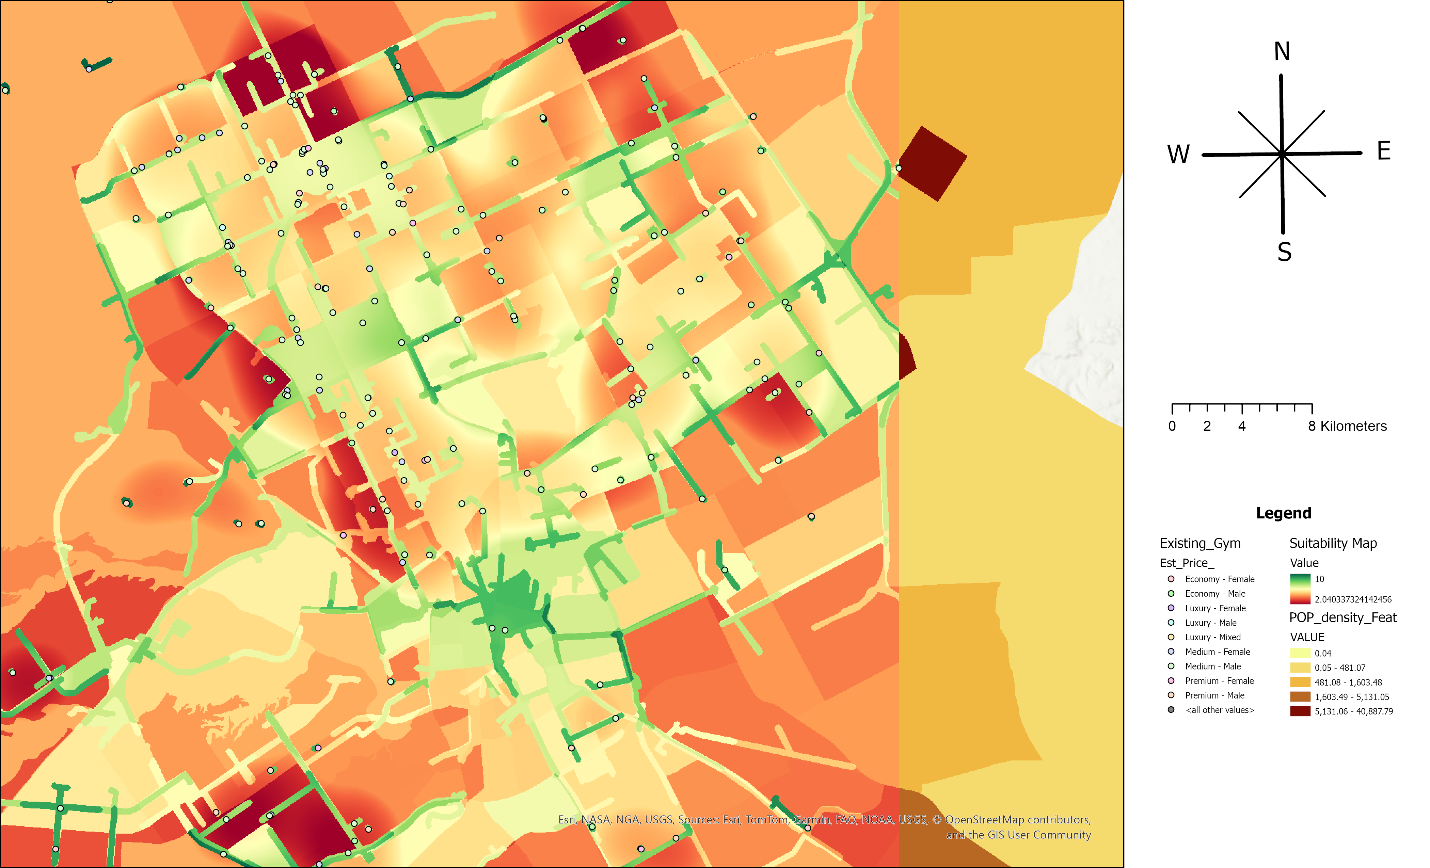
Figure (8) Weighted Overlay composite suitability surface and scoring.
Source: Prepared by the author using ArcGIS Pro.
2.5. Baseline Evaluation of Existing Facilities
To empirically demonstrate the limitations of market-driven site selection, the AHP weights were retrospectively applied to the full population of 273 existing fitness centers across Riyadh. The composite suitability value at each facility’s spatial coordinates was extracted from the standardized 1–10 raster surfaces and weighted using the validated AHP priority vector (54%, 26%, and 20% for Accessibility, Population Density, and Competitor Proximity respectively). The aggregate distribution of suitability scores across all 273 facilities is summarized in Table 4.
| Table (4) Aggregate distribution of AHP composite suitability scores across all 273 existing fitness facilities. | ||
| Statistical Metric | Value | Interpretation |
| Number of facilities (N) | 273 | Full population of operational gyms in Riyadh |
| Mean composite suitability | 7.50 | Average performance tier across the baseline |
| Standard deviation (SD) | 0.94 | High spatial variance indicating inconsistent placement |
| Distribution shape | Centered on mid-tier | Few high-suitability locations; long lower tail driven by competitor saturation |
Source: Prepared by the author based on spatial analysis of the full 273-facility dataset.
The baseline distribution exhibits a mean composite suitability of 7.50 with a standard deviation of 0.94, indicating that current site placement clusters around an average performance tier with substantial spatial variance. The wide score range reflects the heterogeneous outcomes of market-driven, observation-based site selection — confirming that the absence of a deterministic Spatial Decision Support System has produced inconsistent locational quality across the city. Particularly notable is the prevalence of facilities exhibiting low Competitor Proximity scores, attributable to aggressive clustering in already-saturated districts (consistent with the disparities documented in Table 2 and the spatial concentration visible in Figure 2). This empirical pattern directly validates the explanatory power of the Congested Facility Location Problem framework: facilities aggregated within the same catchment area cannibalize one another’s market share rather than extending coverage to underserved districts.
2.6. Prescriptive Location-Allocation Optimization
To transition from descriptive suitability mapping to prescriptive optimization, the Location-Allocation solver within the Network Analyst extension was deployed on the candidate sites previously generated. The solver was configured to maximize population coverage under the 10-minute network impedance constraint and was executed independently for female and male facilities to address the documented gender-disaggregated demand structure. The female-targeted optimization addresses the female facility gap identified in the Quality-of-Life Program objectives, with the proposed spatial distribution visualized at the metropolitan level (Figure 9). A parallel optimization was executed for male facilities to alleviate localized saturation in clustered zones while capturing verified demand, with the optimized allocation detailed at the district level (Figure 10).
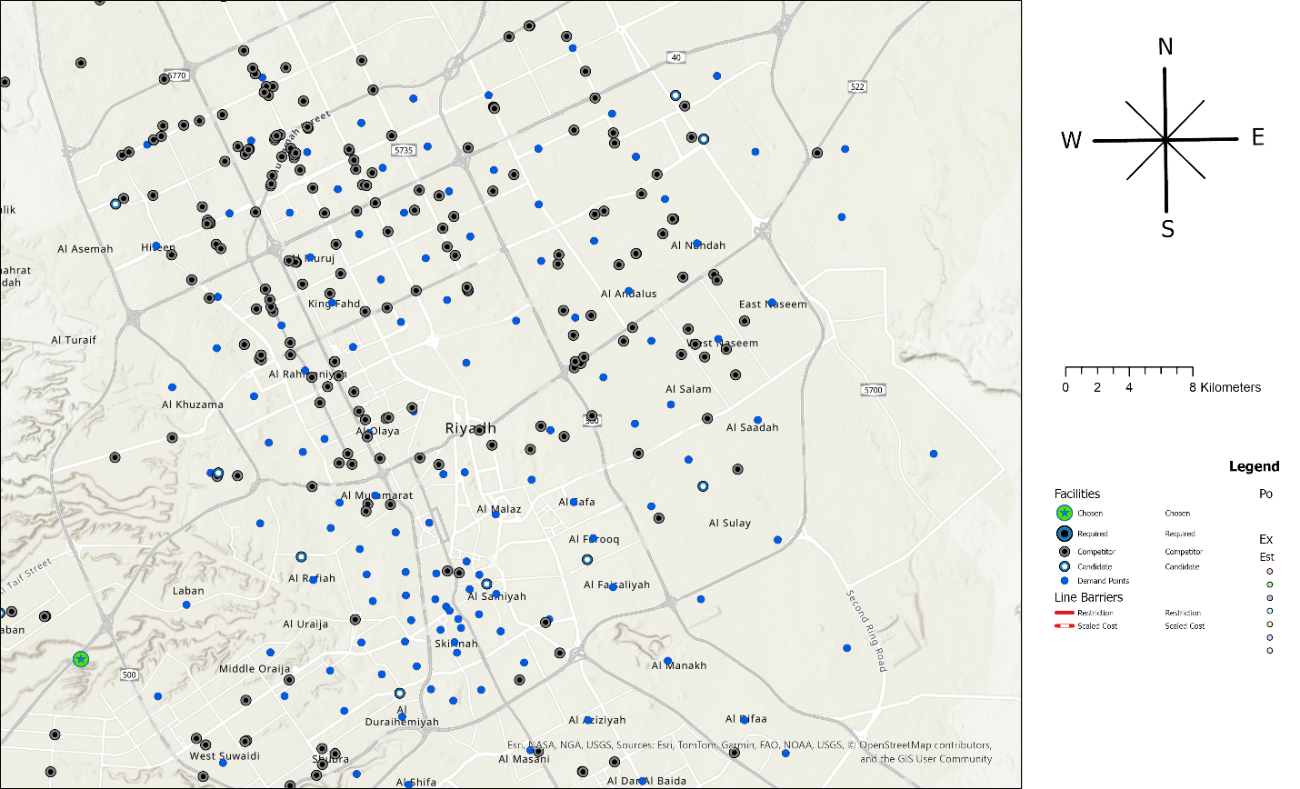
Figure (9) Location-Allocation proposed map for female gym (metropolitan view).
Source: Prepared by the author using ArcGIS Pro.
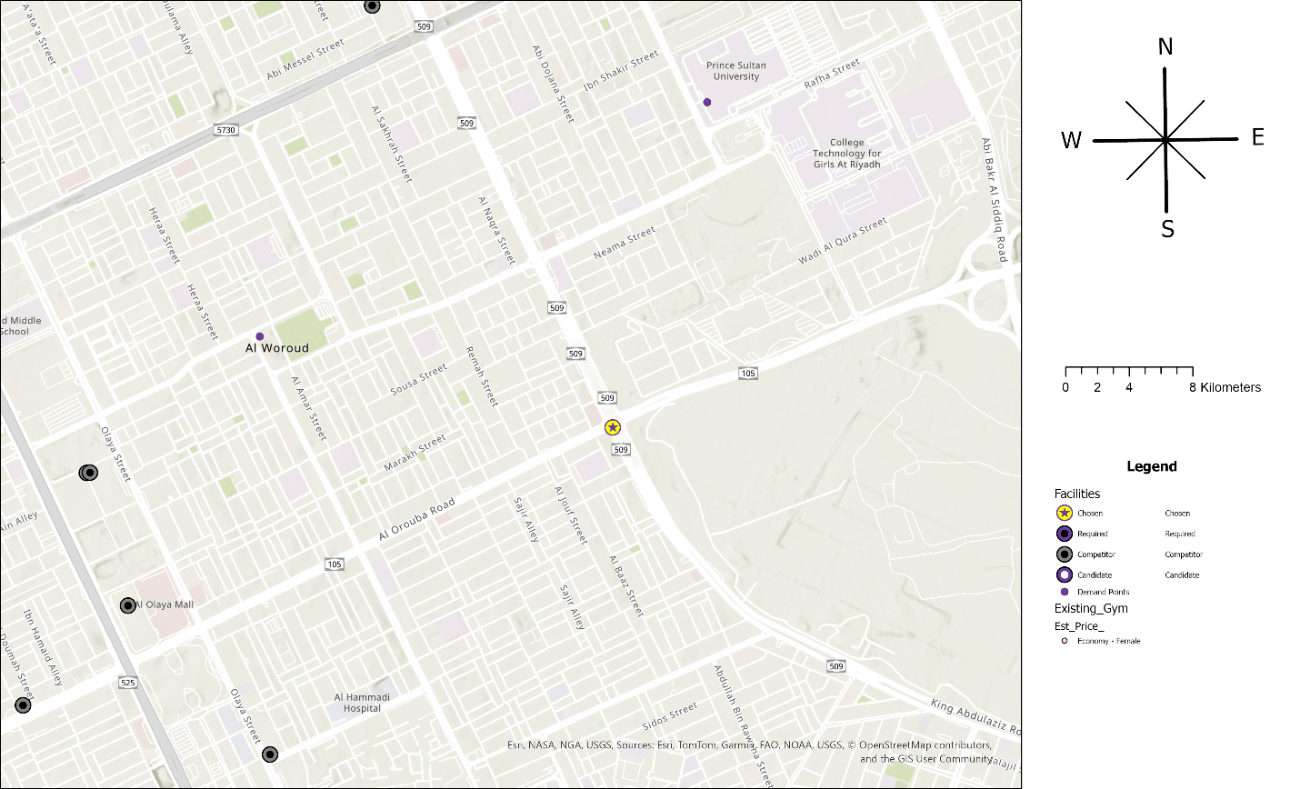
Figure (10) Location-Allocation proposed map for male gym (district level).
Source: Prepared by the author using ArcGIS Pro.
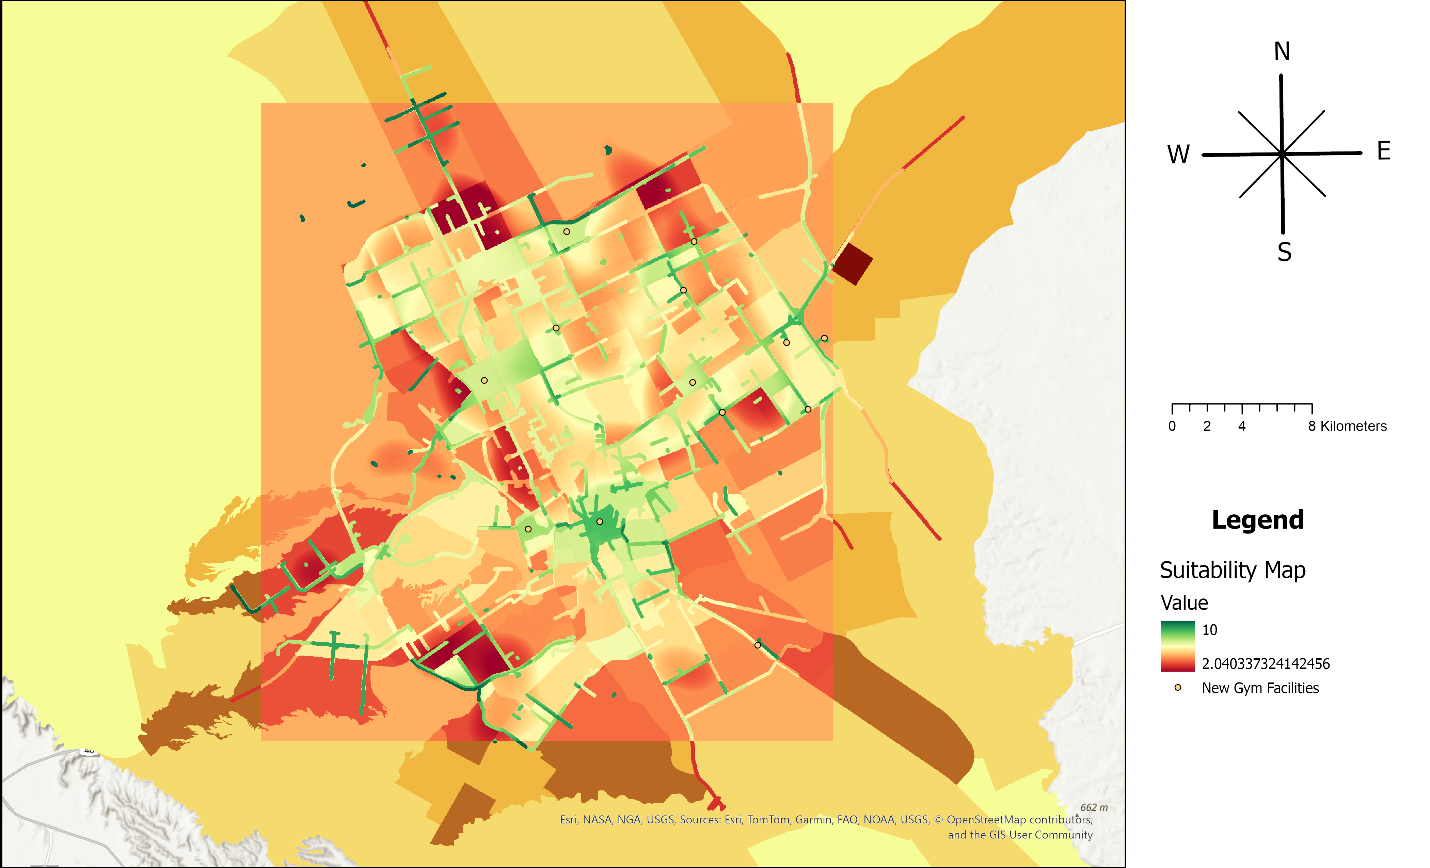
Figure (11) Final spatial results map — all nine proposed locations across the Riyadh metropolitan area.
Source: Prepared by the author using ArcGIS Pro.
3. Results
3.1. Prioritization of Spatial Criteria (AHP Results)
The AHP produced a mathematically verified priority vector: Accessibility 54%, Population Density 26%, and Competitor Proximity 20%. The Consistency Ratio (CR = 0.0158) confirmed the logical consistency of the pairwise judgments, falling well within Saaty’s acceptable threshold of CR < 0.10 and verifying the structural soundness of the model prior to composite surface generation.
3.2. Comparative Suitability Performance
The suitability scores reported here do not represent an absolute measure of facility adequacy against a pre-defined standard; they function as a relative performance index, enabling systematic comparison between the existing population of fitness facilities and the model-identified optimal sites under the same weighted criteria. As reported in Section 2.5 (Table 4), the full population of 273 existing facilities exhibited a mean composite suitability of 7.50 with a standard deviation of 0.94, indicating that current sites cluster around an average performance tier with notable spatial variance. By contrast, the Location-Allocation solver mathematically restricted its selection to top-tier candidate sites, producing a significantly elevated mean score of 8.31 with a markedly tighter standard deviation of 0.53 (Table 5). The optimization model successfully eliminated low-suitability outliers and restricted selections to a narrow, high-performing tier, demonstrating that the integrated AHP–Location-Allocation framework produces measurably superior spatial outcomes relative to market-driven, observation-based site selection.
3.3. Spatial Variance and Catchment Consistency
Network analysis demonstrated a high degree of spatial consistency in the proposed locations. The existing baseline facilities exhibited a high standard deviation (SD = 0.94), indicating erratic placement and fluctuating spatial quality. By contrast, the proposed model achieved an exceptionally low standard deviation of 0.53. The Location-Allocation solver successfully allocated surrounding demographic demand points almost entirely within the validated 10-minute network drive-time catchments, verifying that the model systematically maximized predictable footfall while maintaining geographic distance from saturated competitor zones.
3.4. Spatial Land-Use Conflicts
When the optimized coordinates were cross-referenced with current municipal zoning classifications, spatial analysis revealed that several of the highest-performing proposed candidate sites (scoring ≥ 8.0) are located within strictly residential parcels rather than designated commercial corridors. The algorithm mathematically prioritized these residential nodes because they offer peak demographic density and immediate network accessibility, effectively minimizing travel impedance. This finding highlights a disconnect between deterministic spatial optimization and traditional land-use regulations, indicating that the “limited spaces” barrier identified in the Quality-of-Life Program is driven by restrictive zoning classifications rather than a lack of physical spatial capacity.
3.5. Final Spatial Optimization Outcome
The Location-Allocation solver identified nine high-suitability candidate sites distributed across previously underserved districts, with an average composite suitability score of 8.31 (Table 5). The peak suitability score of 9.26 was achieved by a female-specific candidate location situated in a high-density residential zone lacking any existing female facility within the 10-minute network catchment. Even the lowest-scoring proposed site (7.47) marginally underperforms the population mean of 7.50 observed across the existing 273-facility baseline (Section 2.5; Table 4), while the remaining eight proposed sites substantially exceed it. The narrow distribution of scores (range = 1.79; SD = 0.53) indicates spatial consistency in the model’s selection logic — a direct contrast to the wider variance (SD = 0.94) observed across the market-driven baseline.
| Table (5) Composite suitability scores for model-identified proposed candidate sites. | |
| Proposed Location | Spatial Suitability Score (1–10 scale) |
| Location 1 | 9.26 |
| Location 2 | 7.62 |
| Location 3 | 8.43 |
| Location 4 | 7.47 |
| Location 5 | 8.48 |
| Location 6 | 8.50 |
| Location 7 | 8.54 |
| Location 8 | 8.24 |
| Location 9 | 8.27 |
Source: Prepared by the author based on Location-Allocation outputs.
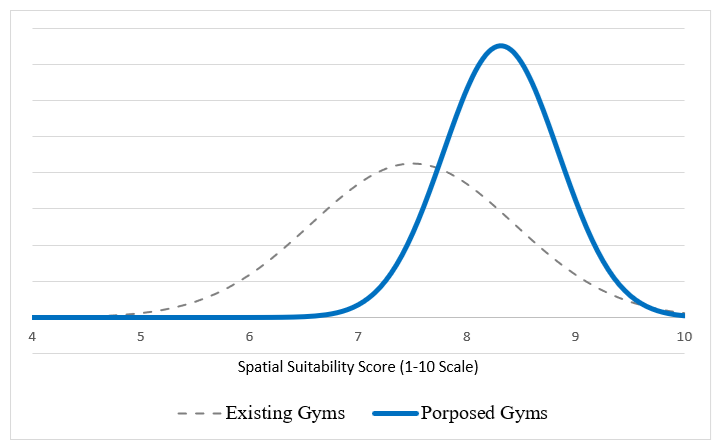
Figure (12) Comparative density distribution of suitability scores for existing vs. proposed gym locations.
Source: Prepared by the author.
4. Discussion
The results carry three interlocking implications. First, the dominance of network-based accessibility in the AHP priority vector (54%) empirically corroborates the position of Jiang et al. (2022) that simple Euclidean proximity is an insufficient metric for measuring access in car-dependent urban environments, and that realistic accessibility must be modeled through network-based travel time along the actual road hierarchy. This finding is further reinforced by Namangale and Dunga (2022) in the retail context. Operationalizing accessibility as a travel-time surface — rather than a buffer distance — is therefore not a methodological refinement but a substantive theoretical commitment.
Second, the empirical evidence from the baseline evaluation across all 273 existing facilities — particularly the prevalence of low Competitor Proximity scores indicative of aggressive clustering in saturated districts — confirms the explanatory power of the Congested Facility Location Problem framework (Jalili Marand & Hoseinpour, 2024). Facilities aggregated within the same catchment cannibalize each other’s market share rather than expanding coverage to underserved districts. This finding extends the diagnostic conclusions of Qwaider et al. (2023), who identified center–periphery concentration in Riyadh’s sports infrastructure without modeling competitor saturation as a suitability criterion. The present study addresses precisely this analytical omission and demonstrates, through the comparison of existing (N = 273; mean = 7.50; SD = 0.94) and proposed (mean = 8.31; SD = 0.53) site portfolios, that the joint modeling of demand and supply produces measurably superior spatial outcomes.
Third, the spatial land-use conflict identified in Section 3.4 — the placement of the highest-performing candidate sites within residential parcels — surfaces a regulatory dimension that has been largely absent from prior comparable studies. The “limited spaces” barrier articulated by the Quality-of-Life Program (2021) is not, on the evidence of this study, a question of physical land scarcity; rather, it is a function of zoning classifications that restrict mixed-use integration in precisely those high-density districts where demand is greatest. This finding aligns with the Ismael and Bashir (2014) observation that GIS-derived analysis frequently produces results that diverge from established institutional practice, and supports the broader argument for transitioning from observation-based to evidence-based site selection.
The gender-disaggregated optimization addresses a gap identified in prior Riyadh-focused research. Qwaider et al. (2023) provided a diagnostic spatial analysis of facility distribution against Vision 2030 targets but did not disaggregate demand by gender. The present study operationalizes the Quality-of-Life Program’s identification of “limited choices for women” (Quality-of-Life Program, 2021) by executing the Location-Allocation solver independently for female and male facilities. The peak suitability score of 9.26 — corresponding to a female-specific candidate site in a high-density residential zone with no existing female facility within the 10-minute network catchment — quantifies the magnitude of the structural deficit.
Two methodological caveats warrant explicit acknowledgment. First, the AHP pairwise comparisons were performed by the researcher and grounded in the empirical consensus of the reviewed literature rather than through independent expert elicitation or a Delphi panel. This literature-anchored AHP variant is methodologically transparent and produces a Consistency Ratio (0.0158) well within Saaty’s acceptable threshold, but it remains a subjectivity boundary of the study. Second, the spatial resolution is bounded by the district-level granularity of GASTAT demographic data; sub-district demand heterogeneity — emphasized as analytically important by Aboulola et al. (2021) — is not captured by the present model. Both limitations are tractable in future research through expert elicitation procedures and sub-district data enrichment, respectively.
5. Conclusion and Recommendations
This study has demonstrated that the spatial allocation of fitness infrastructure in Riyadh can be systematically resolved through the integration of GIS, the Analytic Hierarchy Process, and Location-Allocation modeling. The four-phase methodology produced a mathematically verified AHP priority vector (Accessibility 54%; Population Density 26%; Competitor Proximity 20%; CR = 0.0158), an empirically validated baseline assessment exposing significant inefficiencies in current market-driven placement (mean = 7.50; SD = 0.94), and a prescriptive optimization yielding nine high-suitability candidate sites distributed across underserved districts (mean = 8.31; SD = 0.53). The framework explicitly operationalizes the Congested Facility Location Problem, addresses the documented gender-disaggregated demand structure, and surfaces a previously underexamined regulatory dimension in the form of residential–commercial zoning misalignment in high-demand districts.
Building on these findings, four strategic recommendations are advanced:
- Targeted mixed-use rezoning protocols should be initiated by competent regulatory and planning authorities within the high-density cold spots identified by the spatial model. Strategically transitioning restrictive residential parcels into mixed-use corridors will directly resolve the “limited spaces” barrier and allow operators to integrate fitness infrastructure into the localized urban fabric.
- Private investors and operators should abandon subjective, observation-based real-estate acquisition and prioritize investment in the high-suitability candidate sites generated by the Location-Allocation solver. This approach provides a data-driven baseline for spatial suitability that exceeds the current market average, reducing capital risk while increasing alignment with documented demographic demand.
- Urban planning entities should adopt the proposed model’s standard deviation (SD = 0.53) as a spatial consistency benchmark for site selection. Integrating this metric into the planning phase ensures that new facilities are restricted to validated 10-minute network catchments, preventing land-use conflict and ensuring that gym infrastructure maximizes demographic utility rather than contributing to localized market saturation.
- To address the immediate demographic deficits, national authorities should incentivize and facilitate private-sector development of female-specific facilities in the highest-ranked candidate sites — through licensing support, investment facilitation, or public-private partnerships — to systematically address the quantified gender-based service coverage deficits.
Future research should focus on three extensions: (i) replicating the framework using expert-elicited AHP weights or Delphi consensus to assess the stability of the priority vector under alternative weighting structures; (ii) integrating sub-district demographic enrichment methods, where data availability permits, to refine demand surface resolution; and (iii) extending the temporal scope through scenario-based projection to model how candidate site rankings evolve under alternative urban growth trajectories toward 2030.
6. References
Abdollahi, M., Faizi, M., & Naghibi, M. (2024). Applying analytic hierarchy process for site selection of a recreational-educational children complex in Shiraz City, Iran. Landscape Online, 99, Article 1120. https://doi.org/10.3097/LO.2024.1120
Aboulola, A. Y., Omar, M. A., & Elkhateeb, A. M. (2021). Fine-grain hybrid data enrichment for micro-spatial urban analysis: Evidence from Greater Cairo. Humanities and Social Sciences Communications, 8, Article 115. https://doi.org/10.1057/s41599-021-01609-x
Balakrishnan, M. (2019). Geospatial data validation procedure and techniques. International Archive of Applied Sciences and Technology, 10(1), 148–153. https://doi.org/10.15515/iaast.0976-4828.10.1.148153
Bopche, P. L., & Neware, S. (2020). Suitable business site selection using GIS. International Journal of Advanced Trends in Computer Science and Engineering, 9(2), 2338–2342. https://doi.org/10.30534/ijatcse/2020/217922020
Dubé, J., Paquet, R., & Thériault, M. (2016). A micro-spatial analysis of retail agglomeration and cannibalisation. Journal of Retailing and Consumer Services, 28, 87–96. https://doi.org/10.1016/j.jretconser.2015.07.006
General Authority for Statistics (GASTAT). (2022). Saudi census 2022: Population characteristics and demographic data [Data set]. Government of Saudi Arabia. https://portal.saudicensus.sa/
Google. (2026). Google Earth Pro (Version 7.3) [Software]. https://www.google.com/earth/versions/#earth-pro
Ismael, M., & Bashir, A. (2014). GIS-based multi-criteria analysis for retail site selection. Arabian Journal for Science and Engineering, 39(6), 4511–4521. https://doi.org/10.1007/s13369-013-0943-8
Jalili Marand, A., & Hoseinpour, P. (2024). A congested facility location problem with strategic customers. European Journal of Operational Research, 318(2), 442–456. https://doi.org/10.1016/j.ejor.2024.05.026
Jiang, Y., Hu, X., Li, J., & Li, Y. (2022). Spatial equity of urban public fitness facilities: A network-based accessibility analysis. International Journal of Environmental Research and Public Health, 19(7), 4003. https://doi.org/10.3390/ijerph19074003
Kingdom of Saudi Arabia. (2016). Vision 2030. Government of Saudi Arabia. https://www.vision2030.gov.sa/media/rc0b5oy1/saudi_vision203.pdf
Namangale, D., & Dunga, G. (2022). Location analysis for retail property investment — A GIS-based approach: Case study of Blantyre City. Journal of Techno-Social, 14(1), 20–27. https://doi.org/10.30880/jts.2022.14.01.004
Ponsiglione, C., Di Rauso, S., Ruggiero, A., & Santalucia, F. (2022). Assessing land suitability through AHP: Methodological rigour and consistency-ratio assessment. Land, 11(4), 554. https://doi.org/10.3390/land11040554
Quality-of-Life Program. (2021). Quality-of-Life Program delivery plan 2021–2025. Government of Saudi Arabia. https://www.vision2030.gov.sa/media/tlzdi3q2/2021-2025-quality-of-life-program-delivery-plan-en.pdf
Qwaider, A., Al-Ghamdi, S., Khan, M. I., & Al-Hasan, M. I. (2023). Evaluating sports-facility distribution to support Vision 2030 targets in Riyadh using GIS. Sustainable Cities and Society, 93, 104613. https://doi.org/10.1016/j.scs.2023.104613
Saaty, T. L. (1980). The Analytic Hierarchy Process. McGraw-Hill.
Topuz, M., & Deniz, E. (2023). GIS-based land-suitability analysis for sustainable rural development in Demirci District, Turkey. Humanities and Social Sciences Communications, 10, Article 115. https://doi.org/10.1057/s41599-023-01554-1