

Enhanced Performance Analysis of Routing Algorithms in Computer Networks Using Adaptive Traffic Load Simulation
تحليل مُحسَّن لأداء خوارزميات التوجيه في شبكات الحاسوب باستخدام محاكاة أحمال حركة مرور تكيفية
Amer Jaber Khazaal¹
¹ Chief Programmer, Abu Al-Khaseeb Education Department, Iraq.
DOI: https://doi.org/10.53796/hnsj711/37
Arabic Scientific Research Identifier: https://arsri.org/10000/711/37
Volume (7) Issue (11). Pages: 773 - 781
Received at: 2026-10-10 | Accepted at: 2026-10-17 | Published at: 2026-11-01
Abstract: This paper compares Dijkstra’s and Bellman–Ford algorithms in computer networks using a Monte Carlo simulation with variable traffic loads. A fully connected directed network was implemented in Python with randomly assigned positive link weights. Low, medium, and high traffic conditions were evaluated using delay, throughput, packet loss, and path cost. Repeated simulation runs were used to examine variability and estimate uncertainty. The reported results show increasing delay and packet loss and decreasing throughput as traffic intensity rises. Both algorithms display broadly similar performance across the three load levels, with small differences in delay and throughput. These similarities are consistent with both algorithms solving the same shortest-path problem on the modeled network. The framework supports controlled comparisons under changing load assumptions and illustrates how traffic intensity can dominate modeled performance. However, the delay, throughput, and loss measures are generated by simplified formulas rather than a packet-level network model. The findings therefore describe the specified simulation and should not be treated as evidence of superior congestion control or routing convergence in operational networks. Further evaluation using realistic topologies, explicit queueing, and paired simulation runs would strengthen the comparison.
Keywords: Dijkstra; Bellman–Ford; Monte Carlo simulation; traffic load.
المستخلص: تقارن هذه الدراسة بين خوارزميتي ديكسترا وبيلمان–فورد في شبكات الحاسوب باستخدام محاكاة مونت كارلو مع أحمال متغيرة لحركة المرور. وقد نُفِّذت شبكة موجّهة كاملة الاتصال بلغة بايثون، وأُسنِدت إلى وصلاتها أوزان موجبة عشوائية. وجرت دراسة ثلاثة مستويات للحمل، هي المنخفض والمتوسط والمرتفع، بالاعتماد على التأخير، ومعدل نقل البيانات، وفقد الحزم، وتكلفة المسار. واستُخدمت تشغيلات متكررة للمحاكاة لدراسة التباين وتقدير عدم اليقين. وتُظهر النتائج المعروضة ازدياد التأخير وفقد الحزم، وانخفاض معدل نقل البيانات مع ارتفاع كثافة حركة المرور. كما تُظهر الخوارزميتان أداءً متقاربًا عمومًا عبر مستويات الحمل الثلاثة، مع فروق محدودة في التأخير ومعدل النقل. ويتسق هذا التقارب مع حلّ الخوارزميتين مسألة أقصر مسار نفسها في الشبكة المدروسة. ويتيح الإطار إجراء مقارنات مضبوطة تحت افتراضات متغيرة للحمل، ويوضح إمكان هيمنة كثافة المرور على الأداء المُحاكى. ومع ذلك، فإن مؤشرات التأخير ومعدل النقل والفقد تُولَّد بمعادلات مبسطة، وليست ناتجة عن نموذج يحاكي الشبكة على مستوى الحزم. ولذلك تقتصر النتائج على المحاكاة المحددة، ولا تُعد دليلًا على تفوق إحدى الخوارزميتين في التحكم بالازدحام أو تقارب التوجيه في الشبكات التشغيلية. ومن شأن استخدام طوبولوجيات واقعية، وتمثيل صريح للطوابير، وتشغيلات محاكاة مقترنة، أن يعزز المقارنة.
الكلمات المفتاحية: ديكسترا؛ بيلمان–فورد؛ مونت كارلو؛ أحمال المرور.
Introduction
Routing determines the paths used to transfer data between network nodes. Shortest-path algorithms minimise a specified link-cost function, while the service experienced by users also depends on traffic intensity, queueing, link capacities, and the mechanisms used to update routes. Dijkstra’s and Bellman–Ford algorithms provide established foundations for shortest-path computation [1, 2]. Their computational properties should be distinguished from the end-to-end network performance obtained after routes are installed.
Comparative evaluation therefore requires both a clear graph model and explicit definitions of delay, throughput, and packet loss. Standards for IP performance measurement provide useful reference definitions [5–8], but a synthetic performance formula is not equivalent to an empirical packet-level measurement. Repeated stochastic simulation can reveal variability under the assumptions of a model; its conclusions remain conditional on those assumptions.
Research Problem
The problem addressed is how increasing simulated traffic load affects the comparative performance of Dijkstra’s and Bellman–Ford algorithms in a fully connected directed network with positive random link weights. A further issue is whether small differences in modeled service metrics can be attributed to the routing algorithm when both algorithms seek the same minimum-cost paths. The study asks how delay, throughput, packet loss, and path cost vary across low, medium, and high loads, and how the topology and metric formulas constrain interpretation of these variations.
Research Objectives
1. Construct a Python-based, fully connected directed network with randomly assigned positive link costs.
2. Compare Dijkstra’s and Bellman–Ford algorithms across low, medium, and high simulated traffic loads.
3. Examine delay, throughput, packet loss, and path cost over repeated Monte Carlo runs.
4. Describe uncertainty and identify the limits of attributing modeled performance differences to the routing algorithm.
Literature Review
Classical Shortest Path Foundations
Dijkstra’s original graph formulation establishes an efficient approach to shortest-path computation [1]. Bellman’s routing formulation uses an optimisation recurrence that underlies iterative shortest-path methods [2]. In the setting considered here, both algorithms operate on the same positively weighted graph. Their agreement in minimum path cost is therefore an expected property of correct implementations, rather than evidence that their computational procedures are identical.
Dijkstra’s algorithm requires non-negative weights, whereas Bellman–Ford can accommodate negative edges when no reachable negative cycle prevents a finite shortest path. Neither property alone establishes better resistance to congestion. Such resistance depends on how link costs represent load, how often paths are recomputed, and how packets and queues are modeled. A comparison of the underlying algorithms must therefore avoid attributing protocol-level convergence or packet-delivery behaviour to a shortest-path routine without modeling those mechanisms.
Empirical Comparisons and Evaluation Scope
Alamoudi and Al-Hashimi examined execution and energy behaviour for complete and moderately dense graphs [3]. They found a strong energy advantage for Dijkstra at larger graph sizes, with different behaviour for small cases influenced by the memory hierarchy. Their measurements concern computational resources; they do not establish end-to-end packet loss or congestion performance. This distinction motivates reporting algorithm runtime separately from modeled network delay.
Aldhafferi compared classical and learned shortest-path approaches across several graph topologies, examining runtime, memory, and optimality [4]. The study shows that evaluation outcomes depend on graph structure and the relationship between heuristic information and path cost. Its scope supports topology-aware benchmarking, but should not be extended into unreported claims about throughput or packet-loss improvements in operational networks.
Network Performance Metrics
Delay describes the time required for a packet to traverse a network path. RFC 7679 specifies a one-way delay metric for IP performance measurement [5]. Delay variation is a separate characteristic, addressed by RFC 3393 [9]. These definitions require attention to the measurement endpoints and timing method. In a formula-based simulation, delay must instead be identified as a modeled quantity unless a mapping to physical time has been established.
Throughput concerns successfully delivered data over an observation interval. RFC 2544 provides a methodology for benchmarking network interconnect devices, while RFC 6349 addresses TCP throughput testing [6, 7]. An inverse-delay expression can serve as a synthetic throughput indicator, but it does not independently measure delivered bytes per second. Its downward trend when delay increases is partly built into the formula.
Packet loss measures unsuccessful delivery relative to the packets considered. RFC 7680 defines one-way loss for IP performance metrics [8]. In the present framework, loss is represented by an assumed probability depending on load and path length. This enables controlled sensitivity analysis, but does not directly observe buffer overflow, retransmissions, or routing loops. Joint interpretation of the four metrics must therefore account for their shared model inputs.
Research Gap and Study Position
The literature reviewed here distinguishes shortest-path correctness and computational cost from packet-level service quality. The present study contributes a controlled comparison of two classical algorithms under three synthetic traffic-load settings in a fully connected topology. It examines the sensitivity of formula-based metrics to load and stochastic fluctuation. Its contribution is bounded by this model; a claim of real-world congestion adaptation would require explicit feedback-driven cost updates and packet-level validation.
Methodology
Network Setup and Monte Carlo Simulation
The network was modeled in Python as a fully connected directed graph. Nodes represent routers or switches, and each directed edge has a randomly assigned positive transmission cost. The model is synthetic and is not calibrated to a specific operational network.
Each traffic scenario was evaluated over 10 Monte Carlo iterations, with source–destination paths considered within each run. Pairs sharing the same graph are not necessarily independent observations. Full reproducibility additionally requires reporting the node count, weight distribution, random seed, and numerical traffic multipliers; these settings are not documented in the present description.
Routing Algorithms
The performance of two classical routing algorithms was analysed at different traffic loads:
Dijkstra’s algorithm selects the unvisited node with the smallest tentative distance and relaxes its outgoing edges. It computes minimum-cost paths on graphs with non-negative edge weights [1].
Bellman–Ford repeatedly relaxes edges to compute minimum-cost paths. It also supports negative edge weights provided that no reachable negative cycle invalidates the shortest-path solution [2]. This additional capability is not exercised by the positive-weight graph used here.
Performance Metrics and Formulas
The evaluation focused on four key metrics: Delay, Throughput, Packet Loss, and Path Cost. The formulas used in the simulation are as follows:
Delay (latency):
where cost is the sum of edge weights along the path, random_fluctuation is a factor uniformly sampled from [0.8, 1.2] to model real-world variability, and traffic_multiplier reflects Low, Medium, or High traffic levels.
Throughput:
This expression is a synthetic throughput indicator derived from delay; it is not a direct measurement of delivered traffic in bits per second.
Packet Loss:
This expression represents an assumed loss probability based on path length and traffic intensity, rather than an observed count of discarded packets.
Cost:
The sum of the weights of all edges along the selected path.
Statistical Analysis
Confidence-interval estimates were reported using the following expression. Its denominator is based on the number of source–destination pairs:
Here, z_score is the normal critical value, std is the sample standard deviation, and num_nodes denotes the graph size. This expression assumes independent pair-level observations, which is not established because paths share network links and run conditions. For uncertainty across 10 independent Monte Carlo runs, an appropriate run-level interval is the mean ± t₀.₉₇₅,₉ × s_run/√10. The supplied data do not permit recalculation; consequently, the displayed uncertainty should be treated as descriptive and does not establish statistically significant differences between algorithms.
Results
Figures 1–5 present the reported outputs for the two algorithms under low, medium, and high traffic loads. Figure 1 shows a clear increase in modeled delay with load, while the algorithm distributions overlap closely. The boxplots summarise the plotted distributions; they do not, by themselves, establish statistical significance or identify the rule used for whiskers.
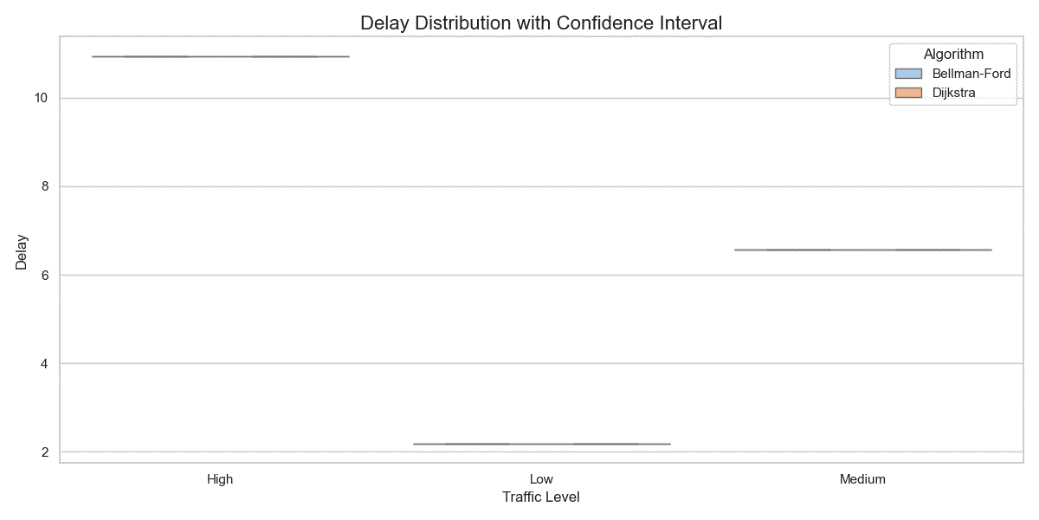
Figure 1 – Delay Distribution with Confidence Interval
Figure 2 shows that the modeled throughput indicator decreases as traffic load increases. This is consistent with its definition as a decreasing function of delay. The two algorithms have closely aligned outputs; the figure does not establish a meaningful throughput advantage for either method.
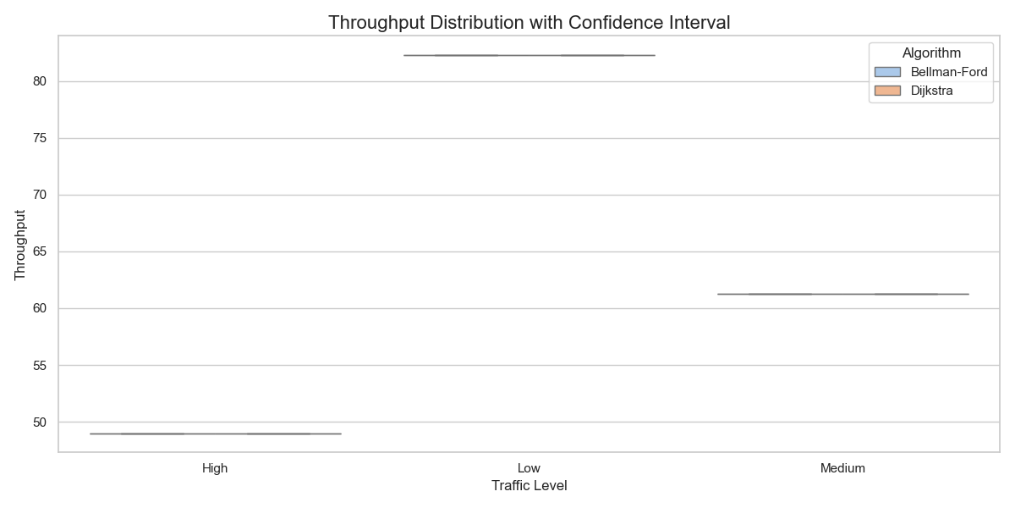
Figure 2 – Throughput Distribution with Confidence Interval
Figure 3 shows increasing modeled packet-loss probability from low to high traffic load. The two algorithm outputs are close. Since loss is generated by a load- and path-length-based expression, these results should not be interpreted as direct evidence of differences in buffer management or congestion resilience.
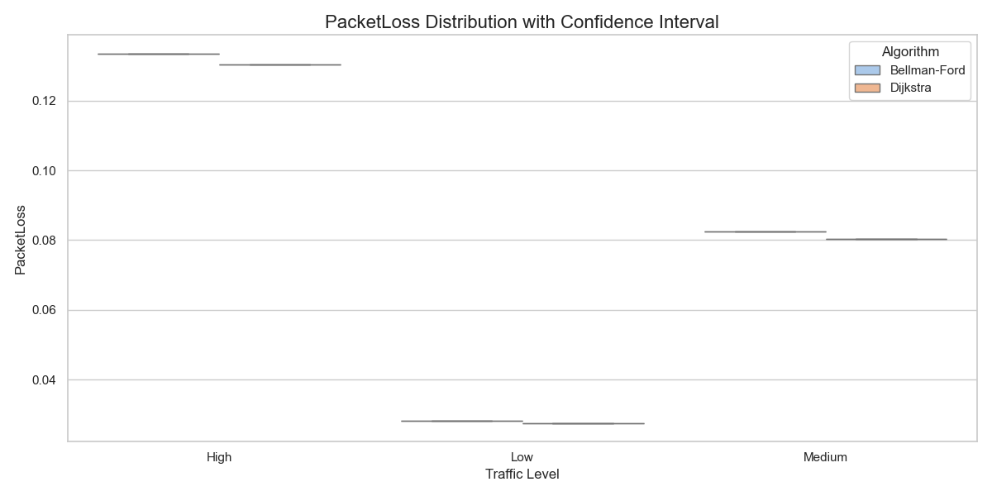
Figure 3 – Packet Loss Distribution with Confidence Interval
Figure 4 shows similar path costs for both algorithms across the traffic categories. Agreement is expected when both algorithms solve the same shortest-path problem using identical positive link weights. Changes in traffic multipliers do not necessarily alter path costs when the underlying edge weights are fixed.
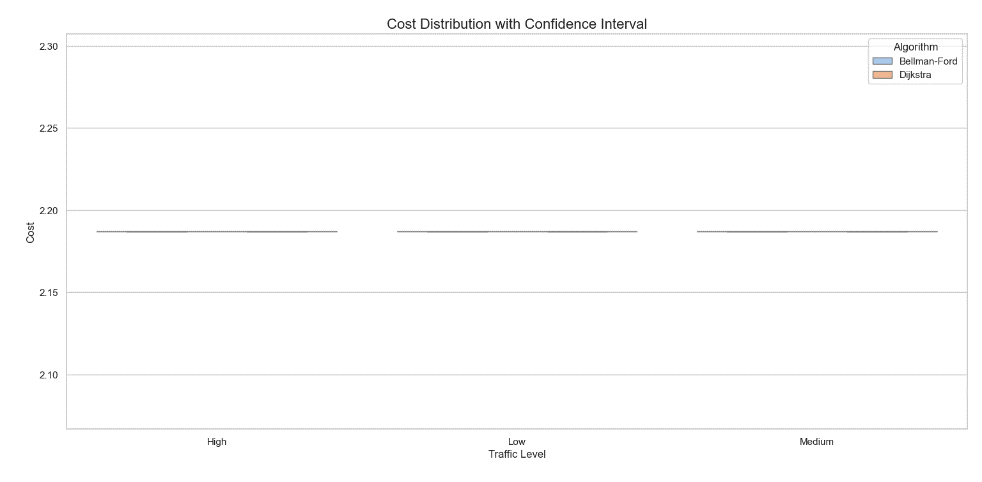
Figure 4 – Cost Distribution with Confidence Interval
Figure 5 summarises the average modeled delay. Both algorithm rows show approximately 2.19 at low load, 6.56 at medium load, and 10.94 at high load. The heatmap is consistent with a strong effect of the selected traffic multipliers and little difference between algorithms in these outputs.
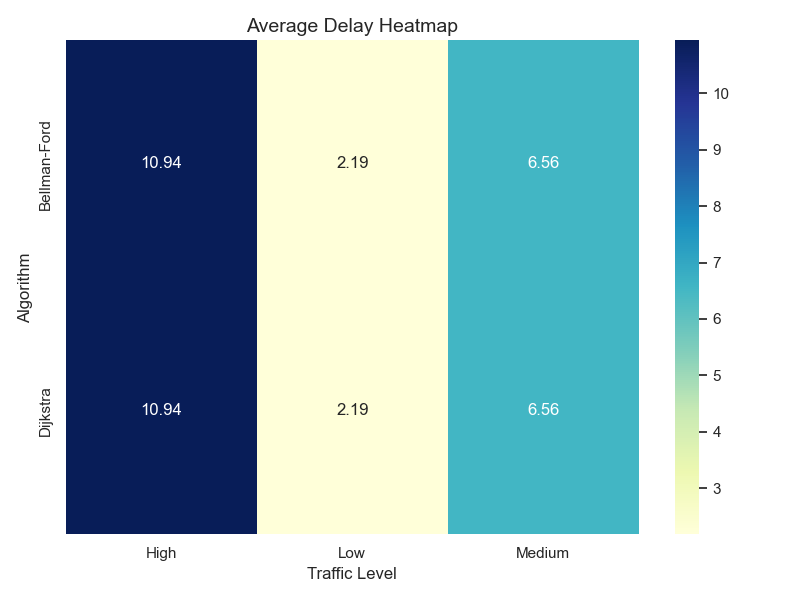
Figure 5 – Average Delay Heatmap
Discussion
The reported outputs show that traffic load is associated with higher modeled delay and loss and a lower throughput indicator. These trends follow partly from the metric definitions: the load multiplier directly scales delay, loss increases with load and path length, and throughput is derived from delay. The simulation therefore illustrates the sensitivity of these formulas to their inputs; it does not independently measure queue formation or packet-level congestion. The close agreement between algorithms is consistent with shortest-path theory. For the same positively weighted graph, both algorithms should return the same optimal path cost, although equal-cost paths can differ. Small differences in derived metrics may reflect independently sampled fluctuations or tie-breaking.
A fair comparison should pair the algorithms on the same graph, source–destination pairs, and stochastic samples. Computational efficiency remains a separate issue. Alamoudi and Al-Hashimi [3] report execution and energy differences, and Aldhafferi [4] examines runtime, memory, and optimality across topologies. These findings motivate broader benchmarking, but they do not validate claims of lower packet loss or faster routing-protocol convergence in the present model. Neither runtime nor convergence overhead is directly reported here. Repeated Monte Carlo runs help describe variation under a specified random process, but repetition alone does not establish independence or eliminate model bias. With only 10 reported iterations and no run-level dataset, the uncertainty estimates cannot be independently recalculated.
Claims that one algorithm is statistically superior should therefore be avoided. The results support a descriptive comparison within the stated assumptions and identify priorities for more realistic experiments.
Conclusion
This study compares Dijkstra’s and Bellman–Ford algorithms in a fully connected directed network with random positive link costs under three synthetic traffic-load levels. The reported outputs show increasing modeled delay and loss and decreasing throughput as load rises, while path costs and algorithm-level outputs remain broadly similar. These results are consistent with both algorithms solving the same shortest-path problem. The main contribution is a controlled illustration of load sensitivity in a stochastic, formula-based framework. The results do not establish that either algorithm has superior congestion control, packet-delivery resilience, or protocol convergence.
Further work should report the complete simulation configuration, use paired random inputs, measure computational overhead, and validate service metrics with explicit queues or packet-level simulation.
Future Work
Future improvements to this work may extend in many directions. For example, the simulation may be applied to larger networks than those considered in this work (e.g. networks with 1000+ nodes) that can help test the scalability of both Dijkstra and Bellman-Ford algorithms when the network is under high traffic loads. Testing at that size allows to have a better understanding of how well the individual algorithms will perform when the total number of network nodes, links and routes will greatly increase in these cases. This question is very important because telecommunication networks in the real world are much larger, complex and dynamic than those used in this study.
Next, dynamic edge weights instead of randomly assigned fixed edge weights can be used in future studies. In real world networks, link costs may change over time due to congestion, failures, variations in bandwidth, or changes in routing policies. By allowing for dynamic edge weights during simulations, the network model will accurately reflect the actual behavior of the network, and the rate at which each routing algorithm can adapt to changes in the network would also be able to be evaluated. Third, future work could incorporate routing algorithms that weren’t evaluated in this paper, such as A*, Floyd-Warshall, and other adaptive/intelligent routing algorithms.
Additional routing algorithms will provide a wider array of algorithms to compare against, so that the best performing routing algorithm in a given traffic scenario can be identified. Examples of using machine learning or reinforcement learning as routing solutions may also be included in future studies as well to evaluate whether intelligent routing can improve routing delays, throughput, and packet loss under dynamic traffic conditions. Lastly, future studies could also include realistic topologies beyond those included in this study, such as mesh, star, random, scale-free, or real ISP-like topologies. The comparison of results across different types of topologies will be valuable in determining the impact of network topology on routing performance.
Collectively, these changes will allow for the development of a simulation framework capable of providing an analysis of the routing strategies used in the design of modern communication networks.
Study Limitations
The analysis uses synthetic link costs and formula-based service metrics rather than explicit packet queues, bandwidth constraints, or protocol exchanges. Increasing the traffic multiplier directly changes the modeled delay and loss expressions, while throughput is derived from delay. These dependencies partly determine the reported trends. Both algorithms should return the same minimum path cost on identical positive-weight graphs; small service-metric differences may reflect random sampling or tie-breaking unless paired runs use identical inputs. The available outputs do not support claims about algorithmic congestion resilience, real-world convergence, or statistical superiority.
References
[1] E. W. Dijkstra, “A note on two problems in connexion with graphs,” Numerische Mathematik, vol. 1, pp. 269–271, 1959. doi: 10.1007/BF01386390.
[2] R. Bellman, “On a routing problem,” Quarterly of Applied Mathematics, vol. 16, pp. 87–90, 1958. doi: 10.1090/qam/102435.
[3] O. Alamoudi and M. Al-Hashimi, “On the Energy Behaviors of the Bellman–Ford and Dijkstra Algorithms: A Detailed Empirical Study,” Journal of Sensor and Actuator Networks, vol. 13, no. 5, art. 67, 2024. doi: 10.3390/jsan13050067.
[4] N. Aldhafferi, “Time and Memory Trade-Offs in Shortest-Path Algorithms Across Graph Topologies: A*, Bellman–Ford, Dijkstra, AI-Augmented A* and a Neural Baseline,” Computers, vol. 14, no. 12, art. 545, 2025. doi: 10.3390/computers14120545.
[5] G. Almes, S. Kalidindi, M. Zekauskas, and A. Morton, “A One-Way Delay Metric for IP Performance Metrics (IPPM),” RFC 7679, Jan. 2016. doi: 10.17487/RFC7679.
[6] S. Bradner and J. McQuaid, “Benchmarking Methodology for Network Interconnect Devices,” RFC 2544, Mar. 1999. doi: 10.17487/RFC2544.
[7] B. Constantine, G. Forget, R. Geib, and R. Schrage, “Framework for TCP Throughput Testing,” RFC 6349, Aug. 2011. doi: 10.17487/RFC6349.
[8] G. Almes, S. Kalidindi, M. Zekauskas, and A. Morton, “A One-Way Loss Metric for IP Performance Metrics (IPPM),” RFC 7680, Jan. 2016. doi: 10.17487/RFC7680.
[9] C. Demichelis and P. Chimento, “IP Packet Delay Variation Metric for IP Performance Metrics (IPPM),” RFC 3393, Nov. 2002. doi: 10.17487/RFC3393.
 Arabic
 English