
Determination of the Photoelectric Properties of Ammonia Concentrations Using a USB-2000 Spectrometer
تحديد الخواص الكهروضوئية لتراكيز الأمونيا باستخدام مطياف USB-2000.
Thowra Abodo1, Abdalla Gobara2
1 University of Dalanj, Department of physics, Sudan. Email: tho72wra@gmail.com
2 University of Dalanj, Department of Chemistry, Sudan. Email: wadgobara35@gmail.com
DOI: https://doi.org/10.53796/hnsj74/22
Arabic Scientific Research Identifier: https://arsri.org/10000/74/22
Volume (7) Issue (4). Pages: 316 - 323
Received at: 2026-02-12 | Accepted at: 2026-02-19 | Published at: 2026-03-01
Abstract: This study investigated the photoelectric properties of ammonia (NH₃) solutions at different concentrations using a USB-2000 spectrometer over the wavelength range of 340–540 nm. Five ammonia concentrations were prepared and analyzed for absorbance, transmittance, reflectance, absorption coefficient, extinction coefficient, refractive index, and optical energy gap. The results showed a pronounced absorption peak at 466 nm, with optical behavior varying according to concentration. Transmittance decreased and reflectance increased as concentration increased, while the absorption coefficient and extinction coefficient showed measurable changes across the visible region. The refractive index reached a maximum value of 1.0022 at the same wavelength for all samples. In addition, the optical energy gap slightly decreased from 2.4996 eV to 2.4902 eV as concentration decreased, indicating that ammonia concentration influences the optical and photoelectric characteristics of the prepared solutions. These findings confirm the usefulness of spectroscopic analysis for evaluating the optical properties of ammonia solutions.
Keywords: Ammonia concentrations, Photoelectric properties, USB-2000 spectrometer, Optical energy gap, Absorbance.
المستخلص: هدفت هذه الدراسة إلى بحث الخواص الكهروضوئية لمحاليل الأمونيا (NH₃) بتراكيز مختلفة باستخدام مطياف USB-2000 ضمن مدى الأطوال الموجية 340–540 نانومتر. جرى تحضير خمسة تراكيز من الأمونيا وتحليلها من حيث الامتصاصية، والنفاذية، والانعكاسية، ومعامل الامتصاص، ومعامل الخمود، ومعامل الانكسار، وفجوة الطاقة البصرية. أظهرت النتائج وجود قمة امتصاص واضحة عند 466 نانومتر، مع اختلاف السلوك البصري باختلاف التركيز. كما انخفضت النفاذية وازدادت الانعكاسية بزيادة التركيز، في حين أظهر كل من معامل الامتصاص ومعامل الخمود تغيرات ملحوظة ضمن المنطقة المرئية. وبلغت القيمة العظمى لمعامل الانكسار 1.0022 عند الطول الموجي نفسه لجميع العينات. إضافة إلى ذلك، انخفضت فجوة الطاقة البصرية انخفاضًا طفيفًا من 2.4996 إلكترون فولت إلى 2.4902 إلكترون فولت مع انخفاض التركيز، مما يدل على أن تركيز الأمونيا يؤثر في الخصائص البصرية والكهروضوئية للمحاليل المحضرة. وتؤكد هذه النتائج أهمية التحليل الطيفي في تقييم الخواص البصرية لمحاليل الأمونيا.
الكلمات المفتاحية: تراكيز الأمونيا، الخواص الكهروضوئية، مطياف USB-2000، فجوة الطاقة البصرية، الامتصاصية.
Introduction:
Ammonia is a gas found naturally in the atmosphere; it is colorless, has a strong odor, and is lighter than air. It is recognized as a toxic substance that can pose health risks when present at elevated levels (Biorn timmer,2005). It’s generated naturally in the soil by bacteria decomposing plants, along with animal and human waste. While prevalent in nature and widely utilized, ammonia is both corrosive and dangerous in its concentrated form (Hibard.H, et al, 2013). It’s a crucial basic chemical material (M. Philipp et al.2018). Meanwhile, Ammonia can be used as a raw material for synthetic nitrogen fertilizer (Guo J. et al.2017). Additionally, it is a potential hydrogen storage material (Makepeace J.W.2019, Satyapal S. et al, 2007) due to its high hydrogen content density (17.6 wt %) (Kyriakou V. et al.2017) and ease of liquefaction. Hydrogen produced by ammonia cracking can fuel vehicles directly (Liu H. 2014). Each ton of ammonia combustion can reduce 1.5 tons of Carbon dioxide emissions (L. Ye et al.2017). Ammonia exhibits outstanding effectiveness in industrial engineering and agriculture, including liquefaction, storage (energy carriers), and transportation, while also being more cost-effective than hydrogen. Therefore, ammonia is anticipated to serve as a fuel for vehicles and fuel cells (Mao C. et al.2018). Ammonia, generated through the Haber process, constitutes nearly all the ammonia utilized in industry; it is employed in producing nitric acid, urea, and nitrogen-based fertilizers (Liptrot, G,F.1983).
In this manuscript, the preparation of five samples of (NH3) involves dissolving in distilled water at varying concentrations. Subsequently, a solution was analyzed with a spectrophotometer for absorbance and transmission across the wavelength range of (340-540 nm) utilizing this model (USB-2000 Spectrometer). To measure the photoelectric properties of the solutions.
Materials and methods:
5 g of ammonia dissolved in 1 liter of water, then take five different concentrations, the USB -2000 spectrometer connects to a notebook and desktop via USB port, when connected to the USB of port of a PC, the USB-2000 draws power from the host PC, eliminating the need for an external power supply.
Results and Discussion:
Preparing five samples of (NH3) by dissolving in distilled water in different concentrations (200, 150, 100, 50 and 7.5 mg/L). Then measurements the optical properties by spectrophotometer absorbance and transmition for wavelength between (340 nm -540 nm) by using this type (USB -2000 Spectrophotometer). Fig.1 shows the relation between absorbance and wavelength, we found the behavior of curves is the same for each curves. The rapid increase of the absorption at 466 nm, these is referring to electronic transition, and this increase is continuous with the increase of photon energy, the effects of concentration on absorbance value increased with concentration decrease of absorbance value. Fig.2 shows the relation between transparent and wavelength, we had been found rapid decrease in low energies and sudden decrease in special energies and it continuous with decrease at 466 nm, concentration increase refers to the decrease in transparent value. The reflection was calculated depended wavelength safe law using the relation:
R + T+ A = 1
When:
R- Reflection
T- Transmition
Fig .3 shows the relation between reflection and wavelength. we had been found rapid increase in reflection value until to arrive to peak, then it reduces from high wavelength because of less absorption in high wavelength transmition decreasing due to reflection increasing using the relation (1). At high energies from wavelength, the absorbance is increasing, this cause the reduce in reflection, and the upper corresponding wavelength value (466 nm). Increasing of concentration due to minor change in to peak curves, it is shifted low energies. The absorption coefficient (α) of (NH3) by dissolving in distilled-water in different concentrations (200mg/L, 150 mg/L, 100 mg/L, 50 mg/L and 7.5 mg/L) were found from the following relation.
α = 2.303 A/t
where (A) is the absorbance and (t) is the optical length on the sample.
Fig.4 shows the plot of (α) with wavelength (λ), which obtained that the value of α >2.88×10⁻¹ cm-1 for all samples in the visible region, this means that the transition must corresponding to a direct electronic transition, and the properties of this state are important, since they are responsible for electrical conduction. Also, fig.4 shows that the value of (α) for the sample 7.5 mg/L are greater than that 200 mg/L samples. Extinction coefficient (K) was calculated using the related.
K = λ α /4 π
The variation at the (K) values as a function of (λ) are shown in fig.5 It is observed that the spectrum shape of (K) as the same shape of (α). Fig.5 obtained the value of (K) at the visible region was depend on the samples treatment method, where the value of (K) at (466) nm for sample 7.5 mg/L is (10-7) while for 150 mg/L at the same wavelength equal (9.3×10⁻⁸) and 200 mg/L equal to (7.3×10⁻⁸) at the same wavelength, this difference in (K) value become smaller at (400 and 520 nm). The refractive index (n) is the relative between speed of light in vacuum to its speed in material which does not absorb this light. The value of n was calculated from the equation:
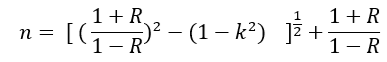
Where (R) is the reflectivity. The variation of (n) vs (λ) is shown in Fig.6 which shows that the maximum value of (n) is (1.0022) for all samples at the same wavelength. Also we can show that the value of (n) begin to increase in the region of spectrum while (K) in its region became constant (466 nm). Also (n) value decrease with concentration decrease, this means that the samples become more transparent in the (466 nm) (VIS) region. The optical energy gap (Eg) has been calculated by the relation.
(αhυ) 2 = C (hυ – Eg)
where (C) is constant. By plotting (αhυ)2 vs photon energy (hυ) as shown in Fig.7 And by extrapolating the straight thin portion of the curve to intercept the energy axis, the value of the energy gap has been calculated. the value of (Eg) obtained was 200 mg/L = 2.4996 eV, 150 mg/L = 2.4956 eV, 100 mg/L = 2.4929 eV, 50 mg/L = 2.4916 eV and 7.5 mg/L= 2.4902 eV. The value of (Eg) was decreased from (2.4996) eV to (2.4902) eV. The decreasing of (Eg) related to decrease in concentration.
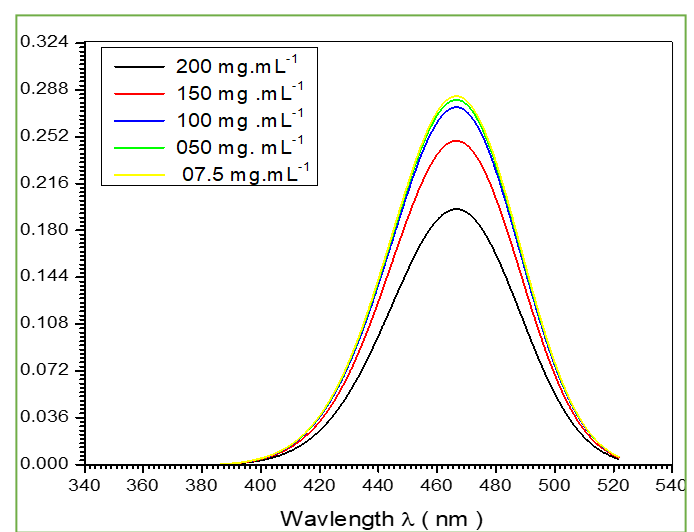
Fig.1 the relation between absorbance and wavelength for ammonia concentrations.
Fig.2 the relation between transparent and wavelength for ammonia concentrations.
Fig .3 the relation between reflection and wavelength for ammonia concentrations.
Fig.4 the plot of (α) with wavelength (λ) for ammonia concentrations.
Fig.5 The variation of extinction coefficient (K) with wavelength (λ) for(NH3) concentrations.
Fig.6 The variation of refractive index (n) with wavelength (λ) for (NH3) concentrations
Fig.7. The optical energy gap (Eg) of ammonia concentrations.
Conclusion:
In conclusion, this study reports that rapid increase of the absorption at 466 nm, compatible with the increase of photon energy, the effect of concentrations on absorbance value increased with concentration decrease of absorbance values. rapid decrease in low energies and sudden decrease in special energies and it continuous with decrease at 466 nm, concentration increase refers to the decrease in transparent value. rapid increase in reflection values. The absorption coefficient (α) for all samples were found in the visible region, variation at the (K) values obtained in the visible region, meanwhile, the variation of (n) vs (λ) is revealed maximum value of (n) is (1.0022) for all samples at the same wavelength. the values of (Eg) obtained were decrease with increase of concentrations.
References:
Björn Timmer, Wouter Olthuis, Albert van den Berg, ammonia sensor and their application are view,2004. https://doi.org/10.1016/j.snb.2004.11.054
Troy Hibbard 1, Karl Crowley, Anthony J Killard, Direct measurement of ammonia in simulated human breath using an inkjet-printed polyaniline nanoparticle sensor,2013. DOI: 10.1016/j.aca.2013.03.051
Matthias Philipp* ,a Gregor Schumma , Ron-Hendrik Peesela , Timothy G. Walmsleyb , Martin J. Atkinsb , Jens Hesselbacha , Optimal energy supply structures for industrial food processing sites in different countries considering energy transitions energy (2018).
DOI: 10.3303/CET1652030
Jianping Guo 1, Ping Chen 1. NH3 as an energy carrier, Chem (2017) https://doi.org/10.1016/j.chempr.2017.10.004
Joshua.W. Makepeace a, Teng He b, Claudia Weidenthaler c, Torben R. Jensen d, Fei Chang e, Tejs Vegge f, Peter Ngene e, Yoshitsugu Kojima g, Petra E. de Jongh e, Ping Chen b, William I.F. David a hl. Reversible ammonia–based and liquid organic hydrogen carriers for high–density hydrogen storage: recent progress , Int J Hydrogen Energy, (2019) https://doi.org/10.1016/j.ijhydene.2019.01.144
Sunita Satyapal a, John Petrovic b 1, Carole Read a, George Thomas c 1, Grace Ordaz a. The U.S. Department of energy’s national hydrogen storage project: progress towards meeting hydrogen-powered vehicle requirements, Catal Today, (2007) https://doi.org/10.1016/j.cattod.2006.09.022Get rights and content
V. Kyriakou, I. Garagounis, E. Vasileiou, A. Vourros, M. Stoukides. Progress in the electrochemical synthesis of ammonia, Catal Today, (2017) https://doi.org/10.1016/j.cattod.2016.06.014
Huazhang Liu, Ammonia synthesis catalyst 100 years: Practice, enlightenment and challenge, Chin J Catal, (2014) https://doi.org/10.1016/S1872-2067(14)60118-2
Lin Ye 1, Richard Nayak-Luke 2, René Bañares-Alcántara 2, Edman Tsang 1. Reaction: “Green” ammonia production, Chem, (2017). https://doi.org/10.1016/j.chempr.2017.10.016
Chengliang Mao, Linghao Yu, Jie Li, Jincai Zhao, Lizhi Zhang. Energy–confined solar thermal ammonia synthesis with K/Ru/TiO2-xHx, Appl Catal B Environ, (2018) https://doi.org/10.1016/j.apcatb.2017.11.010
Liptrot, G.F. 1983 modern inorganic chemistry 4th.ed(modern chemistry series), ISBN 0 7135-1357 8 p- 250-251.